
Chapter The Costs of Production 9 What


- Размер: 1.6 Mегабайта
- Количество слайдов: 26
Описание презентации Chapter The Costs of Production 9 What по слайдам
Chapter The Costs of Production
What are Costs? • Total revenue – Amount a firm receives for the sale of its output • Total cost – Market value of the inputs a firm uses in production • Profit – Total revenue minus total cost
What are Costs? • Costs as opportunity costs – The cost of something is what you give up to get it • Firm’s cost of production – Include all the opportunity costs • Making its output of goods and services
What are Costs? • Costs as opportunity costs • Explicit costs – Input costs that require an outlay of money by the firm • Implicit costs – Input costs that do not require an outlay of money by the firm
What are Costs? • The cost of capital as an opportunity cost – Implicit cost – Interest income not earned • On financial capital – Owned as saving – Invested in business • Not shown as cost by an accountant
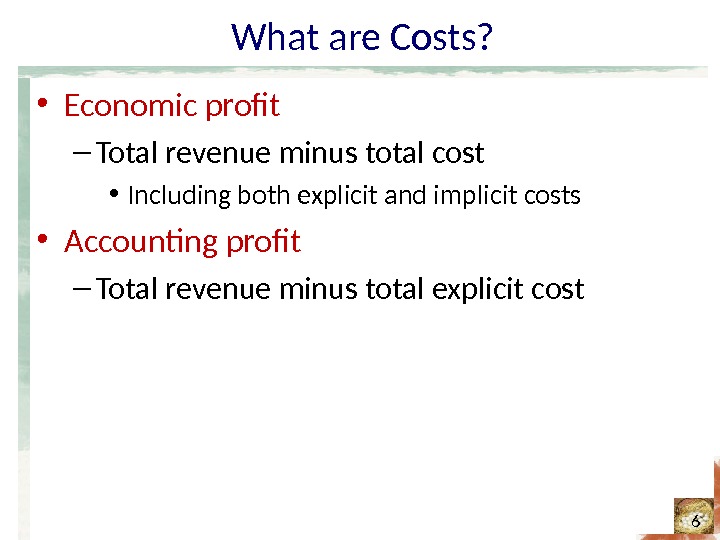
What are Costs? • Economic profit – Total revenue minus total cost • Including both explicit and implicit costs • Accounting profit – Total revenue minus total explicit cost
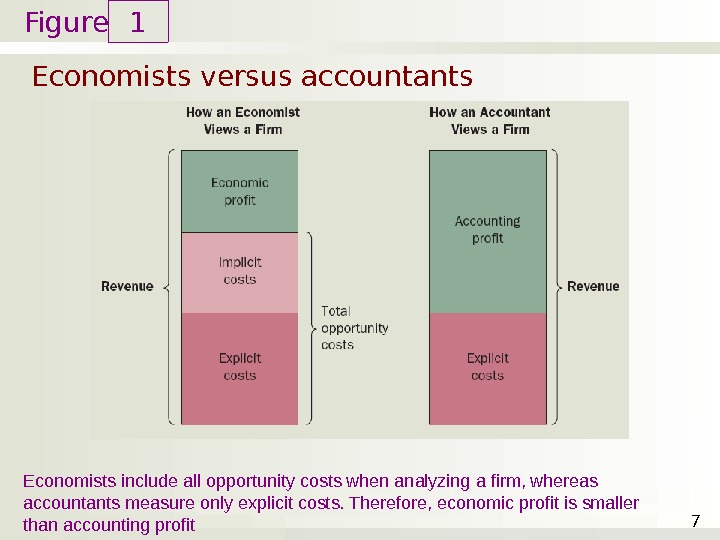
Figure Economists versus accountants 1 7 Economists include all opportunity costs when analyzing a firm, whereas accountants measure only explicit costs. Therefore, economic profit is smaller than accounting profit
Production and Costs • Production function – Relationship between • Quantity of inputs used to make a good • And the quantity of output of that good – Gets flatter as production rises • Rational people think at the margin • Marginal product – Increase in output • Arising from an additional unit of input
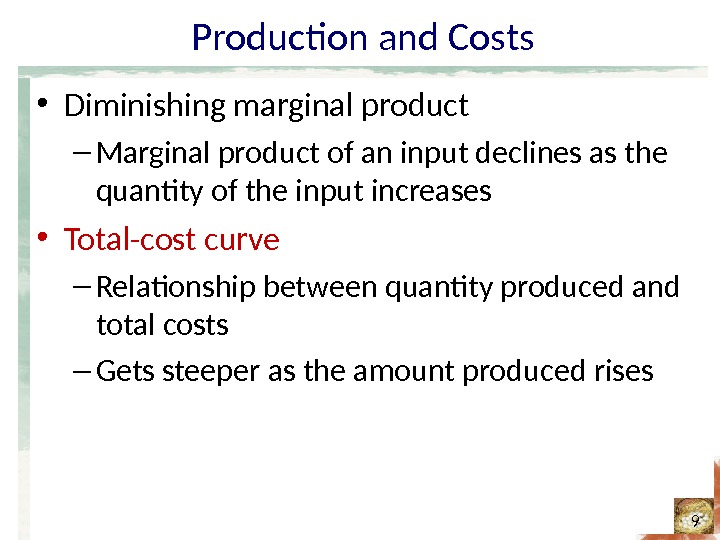
Production and Costs • Diminishing marginal product – Marginal product of an input declines as the quantity of the input increases • Total-cost curve – Relationship between quantity produced and total costs – Gets steeper as the amount produced rises
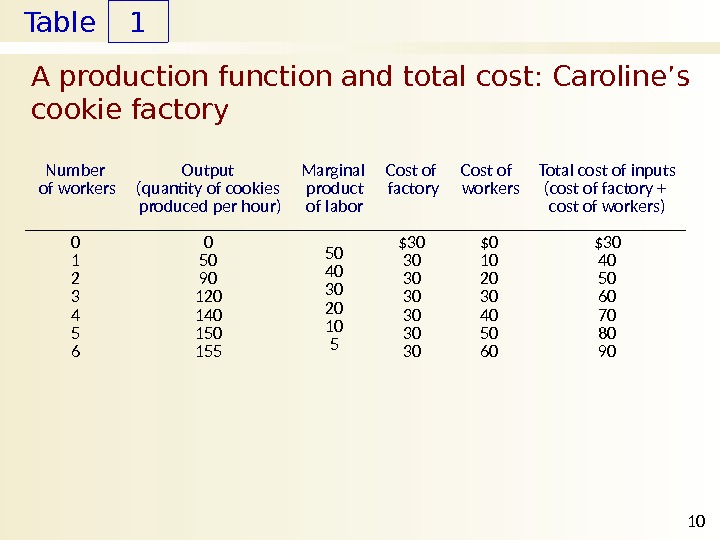
Table A production function and total cost: Caroline’s cookie factory 1 10 Number of workers Output (quantity of cookies produced per hour) Marginal product of labor Cost of factory Cost of workers Total cost of inputs (cost of factory + cost of workers) 0 1 2 3 4 5 6 0 50 90 120 140 155 $30 30 $0 10 20 30 40 50 60 $
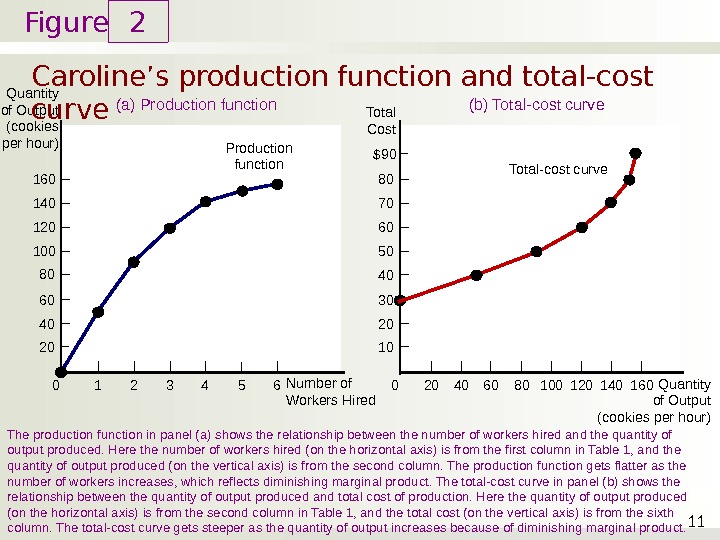
Figure Total Cost 50 40 30 20 1080 70 60$90 Quantity of Output (cookies per hour) 100 80 60 40 20160 140 120 Caroline’s production function and total-cost curve 2 11(a) Production function The production function in panel (a) shows the relationship between the number of workers hired and the quantity of output produced. Here the number of workers hired (on the horizontal axis) is from the first column in Table 1, and the quantity of output produced (on the vertical axis) is from the second column. The production function gets flatter as the number of workers increases, which reflects diminishing marginal product. The total-cost curve in panel (b) shows the relationship between the quantity of output produced and total cost of production. Here the quantity of output produced (on the horizontal axis) is from the second column in Table 1, and the total cost (on the vertical axis) is from the sixth column. The total-cost curve gets steeper as the quantity of output increases because of diminishing marginal product. (b) Total-cost curve Number of Workers Hired 0 1 2 3 4 5 6 Production function Total-cost curve Quantity of Output (cookies per hour)
The Various Measures of Cost • Fixed costs – Do not vary with the quantity of output produced • Variable costs – Vary with the quantity of output produced • Average fixed cost (AFC) – Fixed cost divided by the quantity of output • Average variable cost (AVC) – Variable cost divided by the quantity of output
Table The various measures of cost: Conrad’s coffee shop 2 13 Quantity of coffee (cups per hour) Total Cost Fixed Cost Variable Cost Average Fixed Cost Average Variable Cost Average Total Cost Marginal Cost 0 1 2 3 4 5 6 7 8 9 10 $3. 00 3. 30 3. 80 4. 50 5. 40 6. 50 7. 80 9. 30 11. 00 12. 90 15. 00 $3. 00 3. 00 $0. 00 0. 30 0. 80 1. 50 2. 40 3. 50 4. 80 6. 30 8. 00 9. 90 12. 00 — $3. 00 1. 50 1. 00 0. 75 0. 60 0. 50 0. 43 0. 38 0. 33 0. 30 — $0. 30 0. 40 0. 50 0. 60 0. 70 0. 80 0. 90 1. 00 1. 10 1. 20 — $3. 30 1. 90 1. 50 1. 35 1. 30 1. 33 1. 38 1. 43 1. 50 $0. 30 0. 50 0. 70 0. 90 1. 10 1. 30 1. 50 1. 70 1. 90 2.
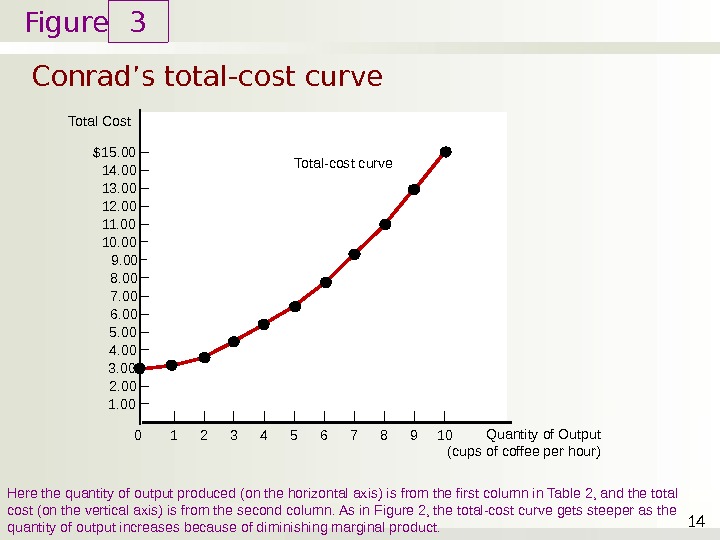
Figure Total Cost 5. 00 4. 00 3. 00 2. 00 1. 00 8. 00 7. 00 6. 00 9. 0010. 0011. 0012. 0013. 0014. 00$15. 00 Conrad’s total-cost curve 3 14 Here the quantity of output produced (on the horizontal axis) is from the first column in Table 2, and the total cost (on the vertical axis) is from the second column. As in Figure 2, the total-cost curve gets steeper as the quantity of output increases because of diminishing marginal product. Quantity of Output (cups of coffee per hour)0 1 2 3 4 5 6 7 8 9 10 Total-cost curve
The Various Measures of Cost • Average total cost (ATC) – Total cost divided by the quantity of output – Average total cost = Total cost / Quantity ATC = TC / Q • Marginal cost (MC) – Increase in total cost • Arising from an extra unit of production – Marginal cost = Change in total cost / Change in quantity MC = Δ TC / Δ Q
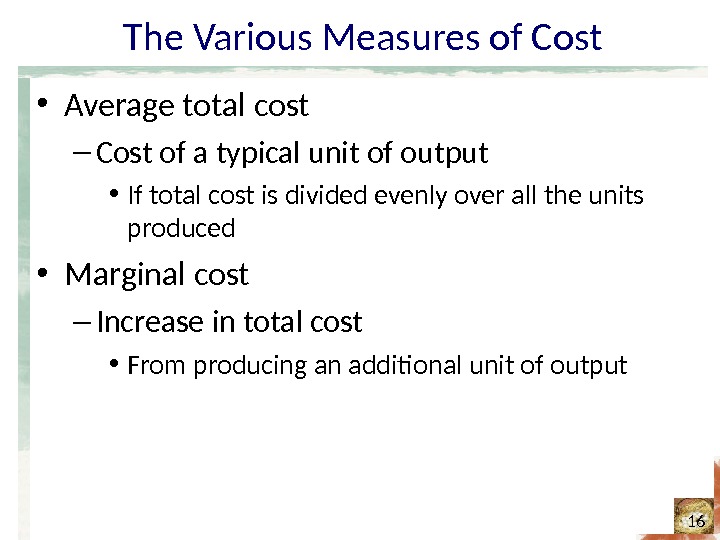
The Various Measures of Cost • Average total cost – Cost of a typical unit of output • If total cost is divided evenly over all the units produced • Marginal cost – Increase in total cost • From producing an additional unit of output
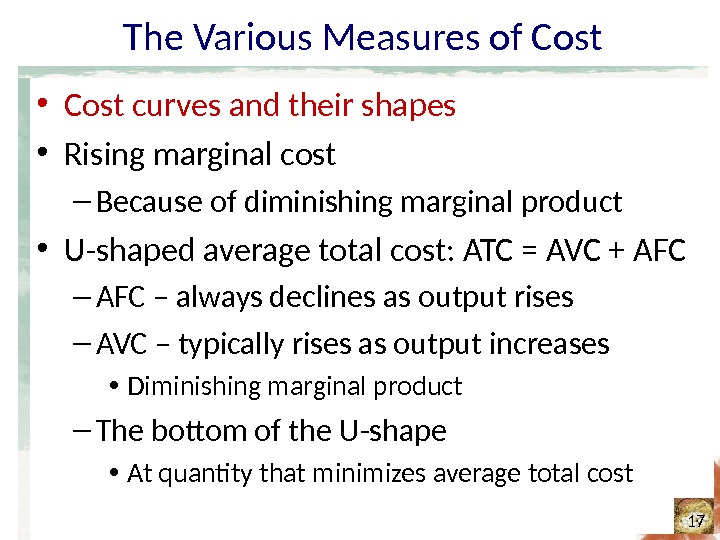
The Various Measures of Cost • Cost curves and their shapes • Rising marginal cost – Because of diminishing marginal product • U-shaped average total cost: ATC = AVC + AFC – always declines as output rises – AVC – typically rises as output increases • Diminishing marginal product – The bottom of the U-shape • At quantity that minimizes average total cost
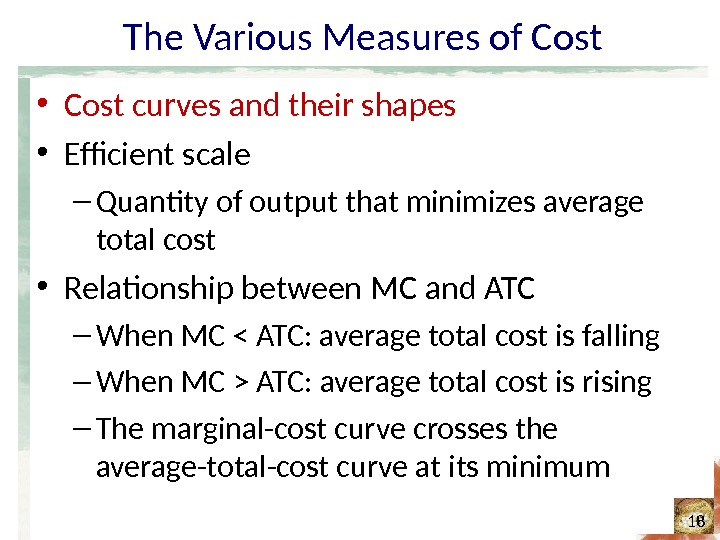
The Various Measures of Cost • Cost curves and their shapes • Efficient scale – Quantity of output that minimizes average total cost • Relationship between MC and ATC – When MC ATC: average total cost is rising – The marginal-cost curve crosses the average-total-cost curve at its minimum
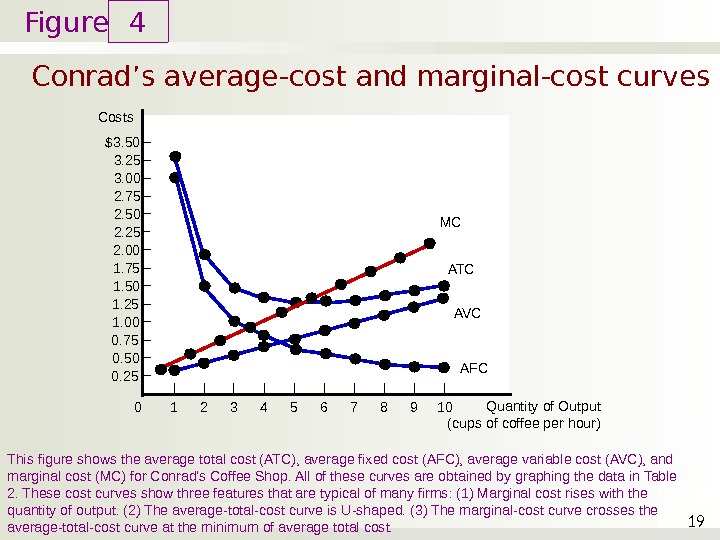
Figure Conrad’s average-cost and marginal-cost curves 4 19 Costs 1. 25 1. 00 0. 75 0. 50 0. 25 2. 00 1. 75 1. 50 2. 252. 502. 753. 003. 25$3. 50 This figure shows the average total cost (ATC), average fixed cost (AFC), average variable cost (AVC), and marginal cost (MC) for Conrad’s Coffee Shop. All of these curves are obtained by graphing the data in Table 2. These cost curves show three features that are typical of many firms: (1) Marginal cost rises with the quantity of output. (2) The average-total-cost curve is U-shaped. (3) The marginal-cost curve crosses the average-total-cost curve at the minimum of average total cost. Quantity of Output (cups of coffee per hour)0 1 2 3 4 5 6 7 8 9 10 AVC AFCATCM
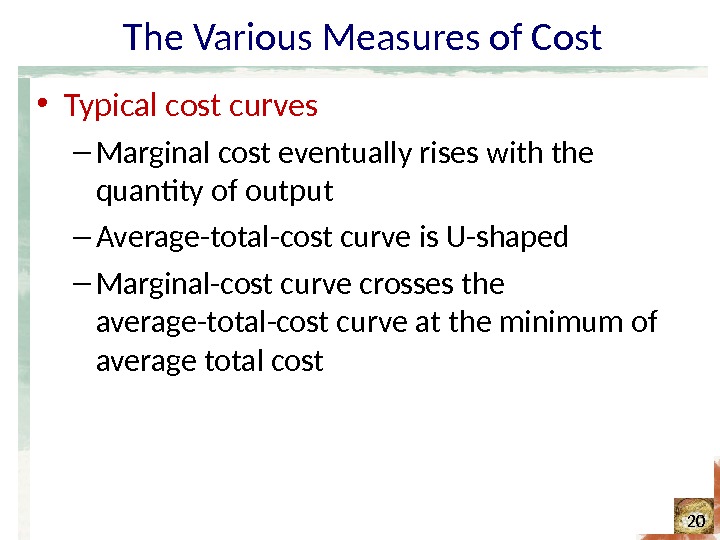
The Various Measures of Cost • Typical cost curves – Marginal cost eventually rises with the quantity of output – Average-total-cost curve is U-shaped – Marginal-cost curve crosses the average-total-cost curve at the minimum of average total cost
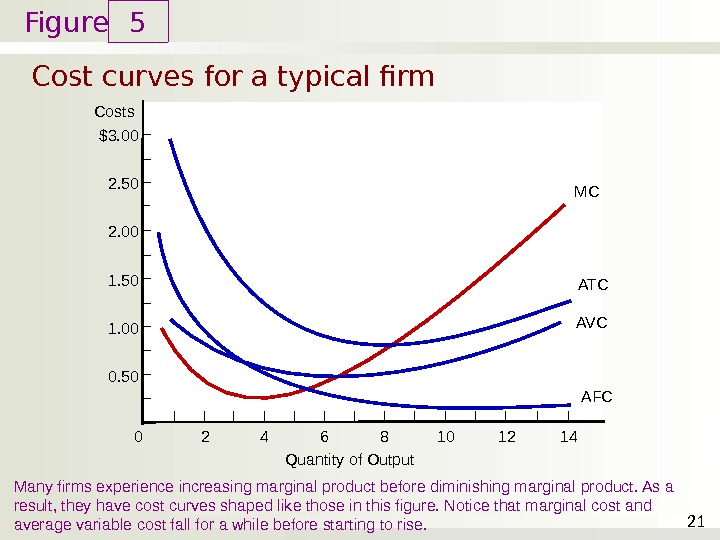
Figure Cost curves for a typical firm 5 21 Costs 1. 00 0. 502. 00 1. 502. 50$3. 00 Many firms experience increasing marginal product before diminishing marginal product. As a result, they have cost curves shaped like those in this figure. Notice that marginal cost and average variable cost fall for a while before starting to rise. Quantity of Output 0 2 4 6 8 10 12 14 MC ATC AV
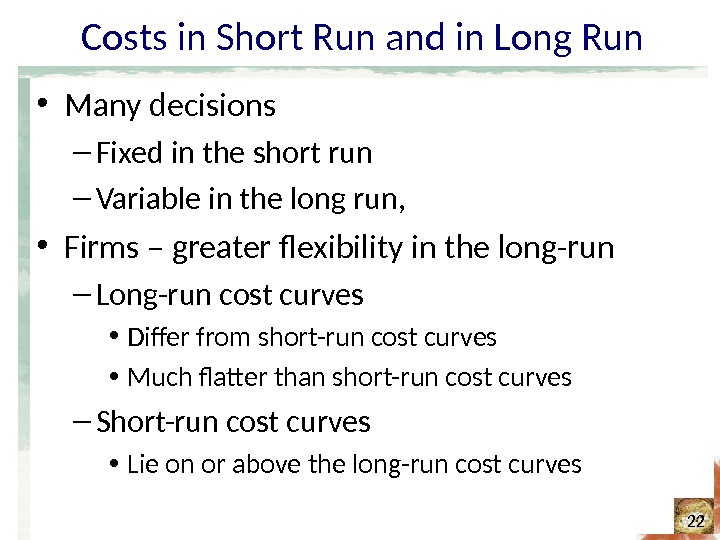
Costs in Short Run and in Long Run • Many decisions – Fixed in the short run – Variable in the long run, • Firms – greater flexibility in the long-run – Long-run cost curves • Differ from short-run cost curves • Much flatter than short-run cost curves – Short-run cost curves • Lie on or above the long-run cost curves
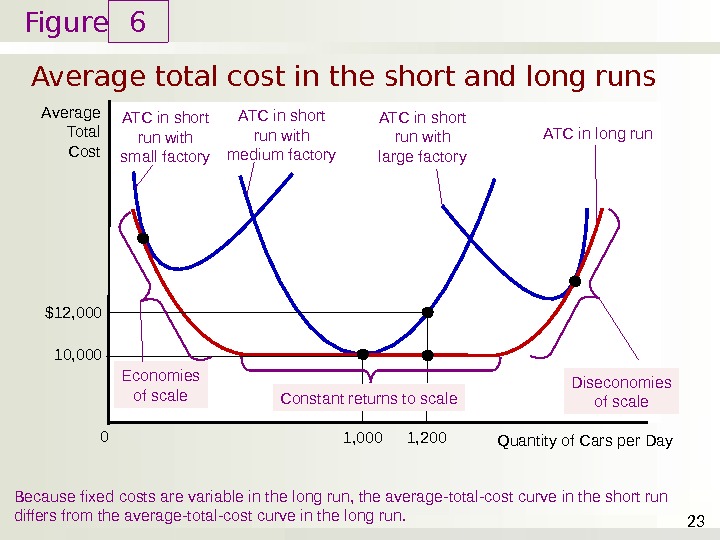
Figure Average total cost in the short and long runs 6 23 Average Total Cost Because fixed costs are variable in the long run, the average-total-cost curve in the short run differs from the average-total-cost curve in the long run. Quantity of Cars per Day 0 ATC in short run with small factory ATC in short run with medium factory ATC in short run with large factory ATC in long run 10, 000$12, 000 1, 200 Economies of scale Diseconomies of scale. Constant returns to scale
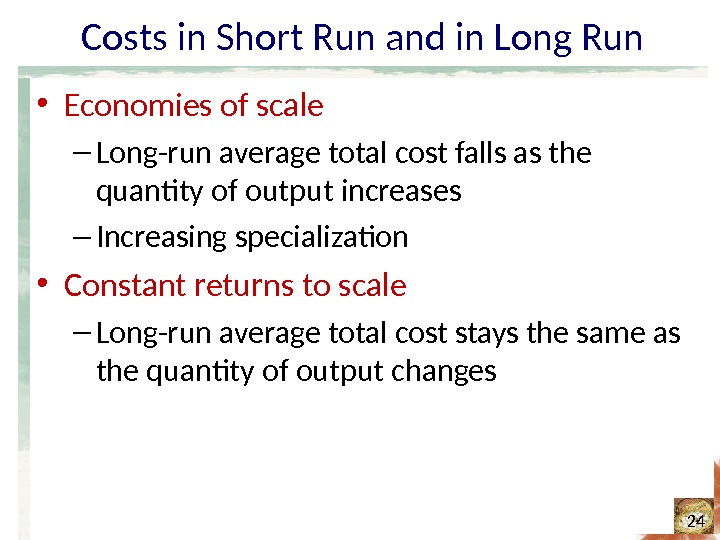
Costs in Short Run and in Long Run • Economies of scale – Long-run average total cost falls as the quantity of output increases – Increasing specialization • Constant returns to scale – Long-run average total cost stays the same as the quantity of output changes
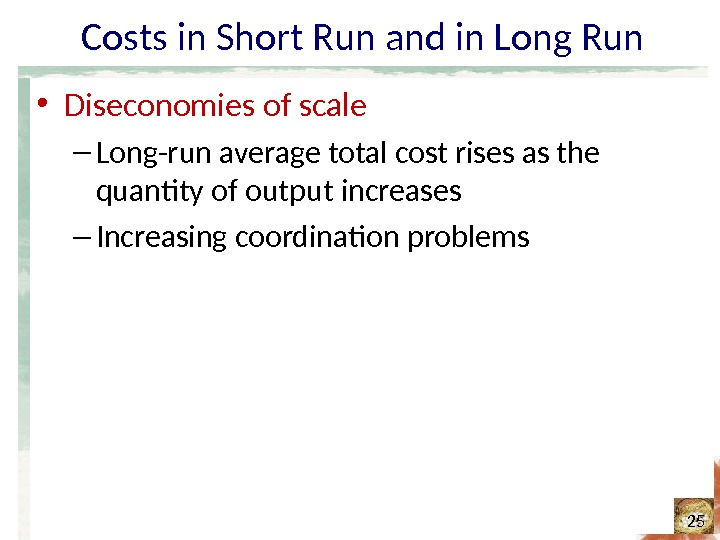
Costs in Short Run and in Long Run • Diseconomies of scale – Long-run average total cost rises as the quantity of output increases – Increasing coordination problems
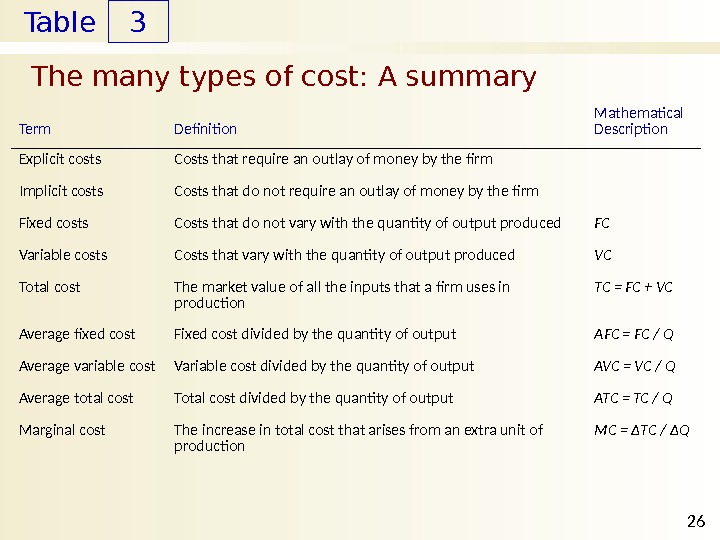
Table The many types of cost: A summary 3 26 Term Definition Mathematical Description Explicit costs Implicit costs Fixed costs Variable costs Total cost Average fixed cost Average variable cost Average total cost Marginal cost Costs that require an outlay of money by the firm Costs that do not vary with the quantity of output produced Costs that vary with the quantity of output produced The market value of all the inputs that a firm uses in production Fixed cost divided by the quantity of output Variable cost divided by the quantity of output Total cost divided by the quantity of output The increase in total cost that arises from an extra unit of production FC VC TC = FC + VC AFC = FC / Q AVC = VC / Q ATC = TC / Q MC = ΔTC / ΔQ