
Chapter 12 Informal Business Reports Business Communication:


lecture3a_1bc_writing_reports.ppt
- Размер: 2 Mегабайта
- Количество слайдов: 39
Описание презентации Chapter 12 Informal Business Reports Business Communication: по слайдам
Chapter 12 Informal Business Reports Business Communication: Process and Product, 6 e Mary Ellen Guffey Copyright ©
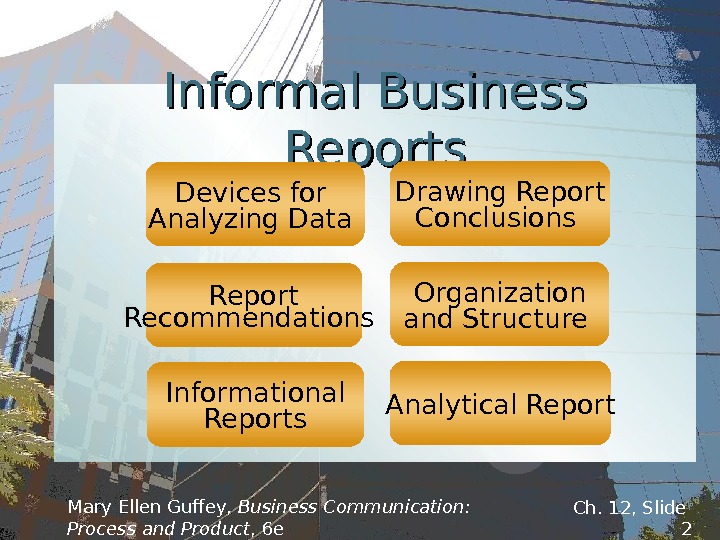
Mary Ellen Guffey, Business Communication: Process and Product , 6 e Ch. 12, Slide 2 Informal Business Reports Organization and Structure Devices for Analyzing Data Drawing Report Conclusions Report Recommendations Analytical Report. Informational Reports
Types of Reports Informational Analytical Mary Ellen Guffey, Business Communication: Process and Product , 6 e Ch. 12, Slide
Mary Ellen Guffey, Business Communication: Process and Product , 6 e Ch. 12, Slide 4 Introduction Identify the report and its purpose. Present a brief overview of the report’s organization, especially for longer reports. When readers are unfamiliar with the topic, briefly fill in the background details. Informational Report Content
Mary Ellen Guffey, Business Communication: Process and Product , 6 e Ch. 12, Slide 5 Body Group facts or findings into three to five roughly equal segments that do not overlap. Organize by time, component, importance, criteria, convention, or some other method. Supply functional or talking heads (at least one per page) to describe each section. Informational Report Content
Mary Ellen Guffey, Business Communication: Process and Product , 6 e Ch. 12, Slide 6 Body Use an informal, conversational writing style unless a formal tone is expected. Use bullets, numbered and lettered lists, headings, underlined items, and white space to enhance readability. Informational Report Content
Mary Ellen Guffey, Business Communication: Process and Product , 6 e Ch. 12, Slide 7 Summary/Conclusi on When necessary, briefly review the main points and discuss what action will follow. If relevant, express appreciation or describe your willingness to provide further information. Informational Report Content
Mary Ellen Guffey, Business Communication: Process and Product , 6 e Ch. 12, Slide 8 Typical Informational Reports Periodic or activity reports Describe production, sales, shipping, service, and other recurring activities. Trip, convention, conference reports Describe an event, summarize three to five main points of interest, itemize expenses, and analyze the event’s value.
Mary Ellen Guffey, Business Communication: Process and Product , 6 e Ch. 12, Slide 9 Typical Informational Reports Progress and interim reports Explain continuing projects including work completed, work in progress, future activities, and completion date. Investigative reports Examine problems and supply facts; provide little analysis.
Mary Ellen Guffey, Business Communication: Process and Product , 6 e Ch. 12, Slide 10 Analytical Report Content Introduction Explain why the report is being written. For research studies, include the significance, scope, limitations, and methodology of the investigation. Preview the report’s organization. Summarize the conclusions and recommendations for receptive audiences.
Mary Ellen Guffey, Business Communication: Process and Product , 6 e Ch. 12, Slide 11 Analytical Report Content Findings Discuss the pros and cons of each alternative. For receptive audiences, consider placing the recommended alternative last. Establish criteria to evaluate alternatives. In “yardstick” studies create criteria to use in measuring each alternative consistently.
Mary Ellen Guffey, Business Communication: Process and Product , 6 e Ch. 12, Slide 12 Analytical Report Content Findings Support the findings with evidence: facts, statistics, expert opinion, survey data, and other proof. Use headings, enumerations, lists, tables, and graphics to focus emphasis.
Mary Ellen Guffey, Business Communication: Process and Product , 6 e Ch. 12, Slide 13 Analytical Report Content Conclusions/Recommendatio ns Develop reasonable conclusions that answer the research question. Justify the conclusions with highlights from the findings. Make recommendations, if asked. Use action verbs. Explain needed action.
Mary Ellen Guffey, Business Communication: Process and Product , 6 e Ch. 12, Slide 14 Typical Short Analytical Reports Justification/recommendation reports Make recommendations to management; provide data to solve problems and make decisions. Feasibility reports Analyze problems and predict whether alternatives will be practical or advisable. Yardstick reports Establish criteria and evaluate alternatives by measuring against the “yardstick” criteria.
Helping the Reader Organizing Information Using Headings Interpreting Data Mary Ellen Guffey, Business Communication: Process and Product , 6 e Ch. 12, Slide
Mary Ellen Guffey, Business Communication: Process and Product , 6 e Ch. 12, Slide 16 Organizing Information Reader comprehension, not writer convenience, should govern report organization. Possible methods: Time Arrange data by chronology: e. g. , 2006, 2007, 2008. Componen tt Arrange data by classifications: location, geography, division, product, or part. A report discussing company profits could be organized by each product.
Mary Ellen Guffey, Business Communication: Process and Product , 6 e Ch. 12, Slide 17 Importance Criteria Conventio nn Order data from most important to least important, or vice versa. Arrange data by evaluative categories. In a report comparing fax equipment, organize by such areas as price, warranty, speed, print quality, etc. Organize data according to prescribed categories. Proposals, for example, are organized by staff, budget, schedule, and so forth. Organizing Information
Mary Ellen Guffey, Business Communication: Process and Product , 6 e Ch. 12, Slide 18 Structural Cues for Reports Discuss purpose and significance of report. Preview main points and order of development. Introduction s Transitions however on the contrary therefore moreover
Mary Ellen Guffey, Business Communication: Process and Product , 6 e Ch. 12, Slide 19 Headings Write short but clear headings. Experiment with wording that tells who, what, when, where, and why. Include at least one heading per report page. Structural Cues for Reports
Mary Ellen Guffey, Business Communication: Process and Product , 6 e Ch. 12, Slide 20 Creating Team Motivation Treating Employees Like Customers ( not Employees Should Be Treated Like Customers) Balance headings within levels. All headings at a given level should be grammatically similar. For example: Structural Cues for Reports Headings
Mary Ellen Guffey, Business Communication: Process and Product , 6 e Ch. 12, Slide 21 Integrate heading gracefully. Try not to repeat the exact wording from the heading in the following sentence. Also avoid using the heading as an antecedent to a pronoun. For example, avoid: CUSTOMER SURVEYS. These are…Headings. Structural Cues for Reports
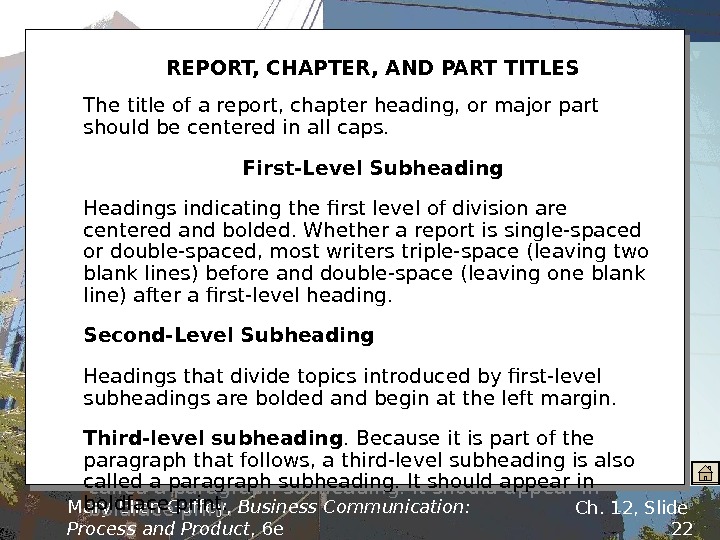
Mary Ellen Guffey, Business Communication: Process and Product , 6 e Ch. 12, Slide 22 Levels of Report Headings REPORT, CHAPTER, AND PART TITLES The title of a report, chapter heading, or major part should be centered in all caps. First-Level Subheading Headings indicating the first level of division are centered and bolded. Whether a report is single-spaced or double-spaced, most writers triple-space (leaving two blank lines) before and double-space (leaving one blank line) after a first-level heading. Second-Level Subheading Headings that divide topics introduced by first-level subheadings are bolded and begin at the left margin. Third-level subheading. Because it is part of the paragraph that follows, a third-level subheading is also called a paragraph subheading. It should appear in boldface print.
Mary Ellen Guffey, Business Communication: Process and Product , 6 e Ch. 12, Slide 23 Meanings Relationships Answers!Interpreting Data You are looking for© Photodisc / Getty Im ages
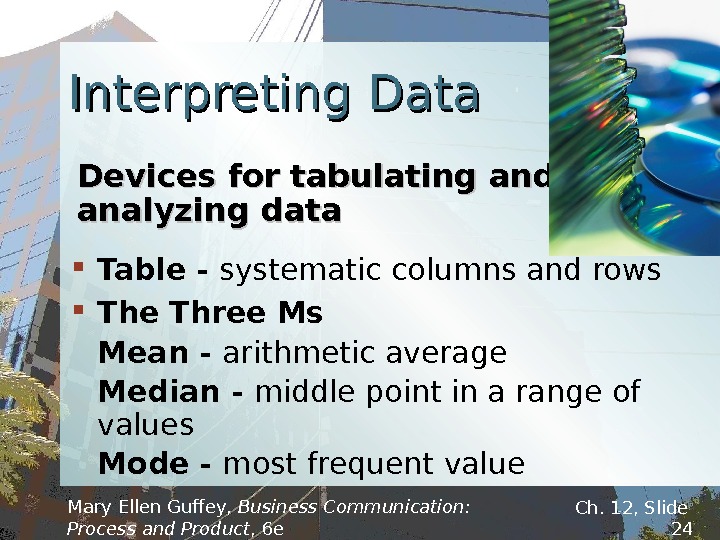
Mary Ellen Guffey, Business Communication: Process and Product , 6 e Ch. 12, Slide 24 Table — systematic columns and rows The Three Ms Mean — arithmetic average Median — middle point in a range of values Mode — most frequent value Interpreting Data Devices for tabulating and analyzing data
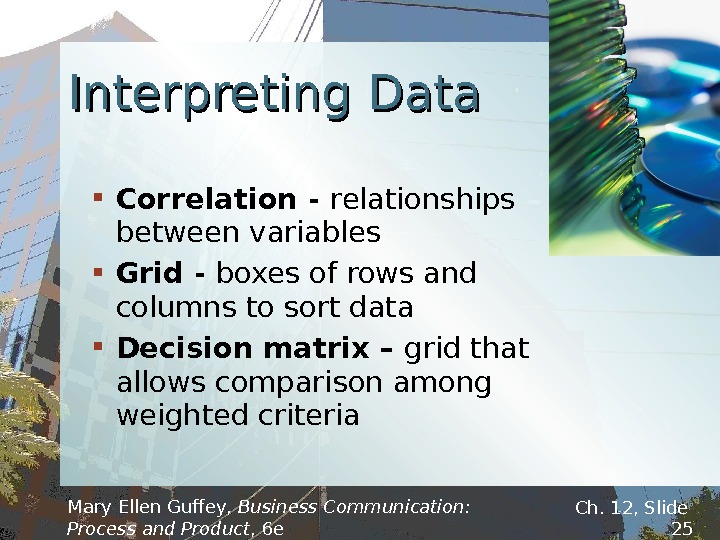
Mary Ellen Guffey, Business Communication: Process and Product , 6 e Ch. 12, Slide 25 Correlation — relationships between variables Grid — boxes of rows and columns to sort data Decision matrix – grid that allows comparison among weighted criteria. Interpreting Data
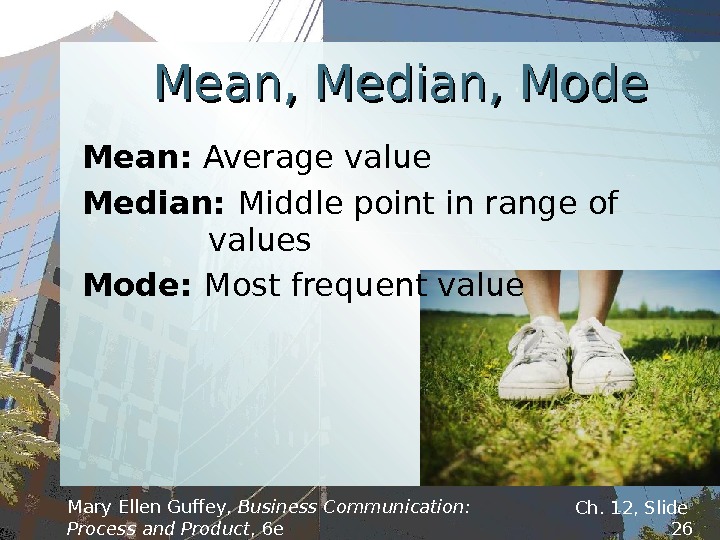
Mary Ellen Guffey, Business Communication: Process and Product , 6 e Ch. 12, Slide 26 Mean: Average value Median: Middle point in range of values Mode: Most frequent value. Mean, Median, Mode
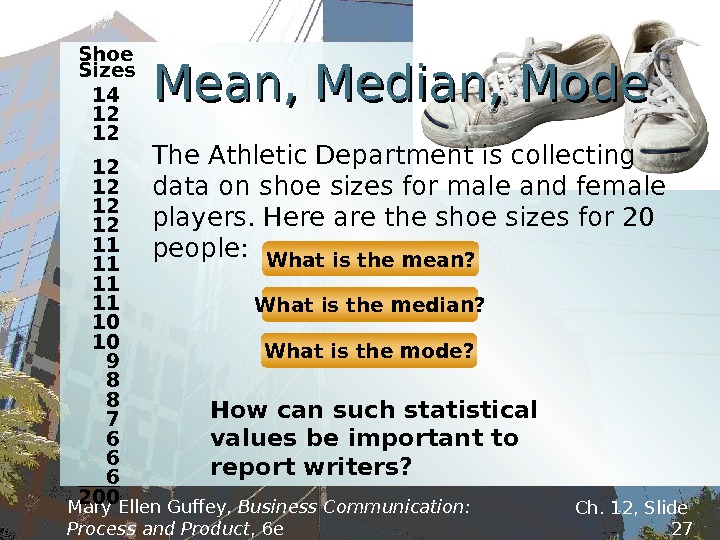
Mary Ellen Guffey, Business Communication: Process and Product , 6 e Ch. 12, Slide 27 The Athletic Department is collecting data on shoe sizes for male and female players. Here are the shoe sizes for 20 people: Shoe Sizes 14 12 12 12 11 11 10 9 8 8 7 6 6 6 200 What is the mean? What is the median? What is the mode? How can such statistical values be important to report writers? Mean, Median, Mode
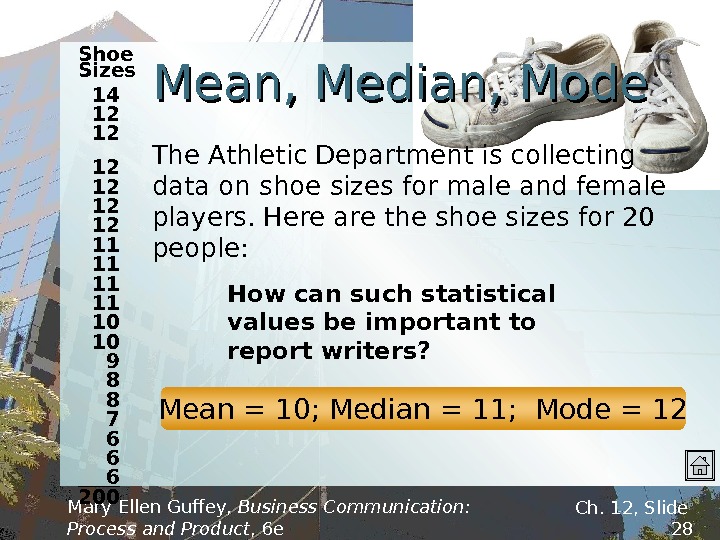
Mary Ellen Guffey, Business Communication: Process and Product , 6 e Ch. 12, Slide 28 Mean = 10; Median = 11; Mode = 12 The Athletic Department is collecting data on shoe sizes for male and female players. Here are the shoe sizes for 20 people: Mean, Median, Mode Shoe Sizes 14 12 12 12 11 11 10 9 8 8 7 6 6 6 200 How can such statistical values be important to report writers?
Tips for Conclusions Recommendations Mary Ellen Guffey, Business Communication: Process and Product , 6 e Ch. 12, Slide
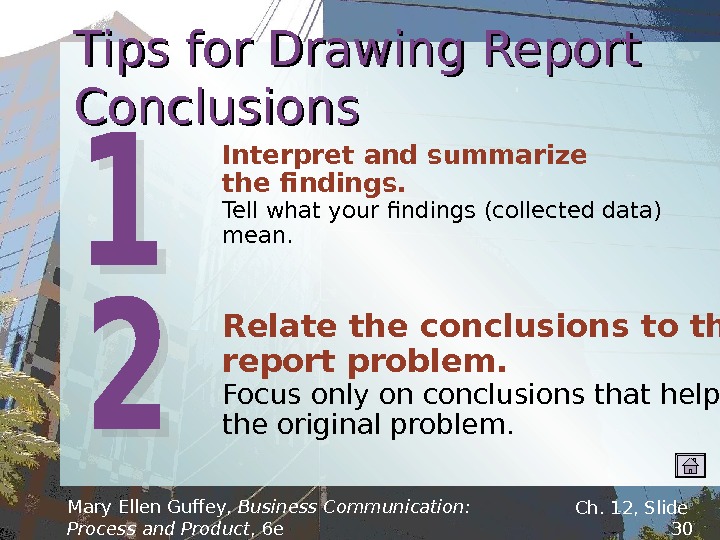
Mary Ellen Guffey, Business Communication: Process and Product , 6 e Ch. 12, Slide 30 Tips for Drawing Report Conclusions Interpret and summarize the findings. Tell what your findings (collected data) mean. Relate the conclusions to the report problem. Focus only on conclusions that help solve the original problem.
Mary Ellen Guffey, Business Communication: Process and Product , 6 e Ch. 12, Slide 31 Limit the conclusions to the data presented. Do not introduce new material. Be objective. Avoid exaggerating or manipulating the data to prove a point. Tips for Drawing Report Conclusions
Mary Ellen Guffey, Business Communication: Process and Product , 6 e Ch. 12, Slide 32 Use consistent criteria. In evaluating options, use the same criteria for each alternative. Enumerate each conclusion. Number and list each item. Present each conclusion in parallel form. Tips for Drawing Report Conclusions
Mary Ellen Guffey, Business Communication: Process and Product , 6 e Ch. 12, Slide 33 Tips for Making Report Recommendations Suggest actions. What specific procedures can help solve the report problem? Focus on recommendations that are practical and agreeable. Suggest feasible actions that would be acceptable to this audience.
Mary Ellen Guffey, Business Communication: Process and Product , 6 e Ch. 12, Slide 34 Present recommendations separately. Enumerate each in a statement beginning with a verb. Invest two thirds of the income in growth funds. If requested, describe how the recommendations may be implemented. Some writers present detailed plans for executing the recommendations. Tips for Making Report Recommendations
Mary Ellen Guffey, Business Communication: Process and Product , 6 e Ch. 12, Slide 35 Conclusion: Survey results show that the biggest student complaint centered on long registration lines. Recommendation: Begin a registration reservation system in which students sign up for specific registration time slots. Conclusions and Recommendations
Mary Ellen Guffey, Business Communication: Process and Product , 6 e Ch. 12, Slide 36 Student Progress Report. DATE: January 2, 2007 TO: Cheryl Bryant, Director OAS Recycling Program FROM: Alan Christopher OAS Business Senator SUBJECT: Progress of Recycling Study at South Bay College This report describes the progress of my project with OAS to study the Sun Coast University recycling program and to make recommendations for increasing participation. Background Although results from the campus recycling program are satisfactory, OAS feels the participation could be increased. As a result, I was asked by OAS to spearhead a campaign to learn more about campus attitudes toward recycling.
Mary Ellen Guffey, Business Communication: Process and Product , 6 e Ch. 12, Slide 37 Student Progress Report (Continued) and to suggest ways to improve our program. I agreed to collect secondary data by reading periodicals about recycling efforts in other parts of the country. More importantly, I agreed to collect primary data by conducting a campus survey. Work Completed Thus far I have completed the secondary research, which included using the library and databases to find current articles about recycling programs in other areas. Several references had particularly relevant data that will be useful as I write my report. To collect data from the campus population, my business communication class and I worked out a pilot questionnaire. We
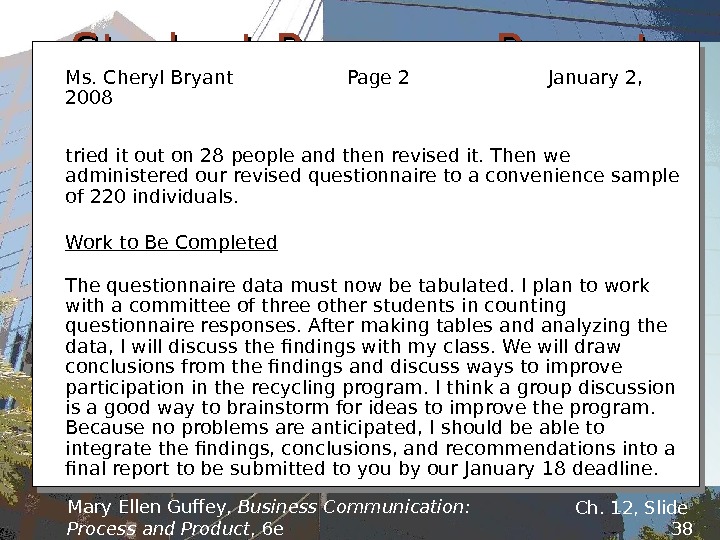
Mary Ellen Guffey, Business Communication: Process and Product , 6 e Ch. 12, Slide 38 Student Progress Report – Continued. Ms. Cheryl Bryant Page 2 January 2, 2008 tried it out on 28 people and then revised it. Then we administered our revised questionnaire to a convenience sample of 220 individuals. Work to Be Completed The questionnaire data must now be tabulated. I plan to work with a committee of three other students in counting questionnaire responses. After making tables and analyzing the data, I will discuss the findings with my class. We will draw conclusions from the findings and discuss ways to improve participation in the recycling program. I think a group discussion is a good way to brainstorm for ideas to improve the program. Because no problems are anticipated, I should be able to integrate the findings, conclusions, and recommendations into a final report to be submitted to you by our January 18 deadline.
End. End Mary Ellen Guffey, Business Communication: Process and Product , 6 e Ch. 12, Slide