

2087489fdb3545d47919ca9d3edd0664.ppt
- Количество слайдов: 69
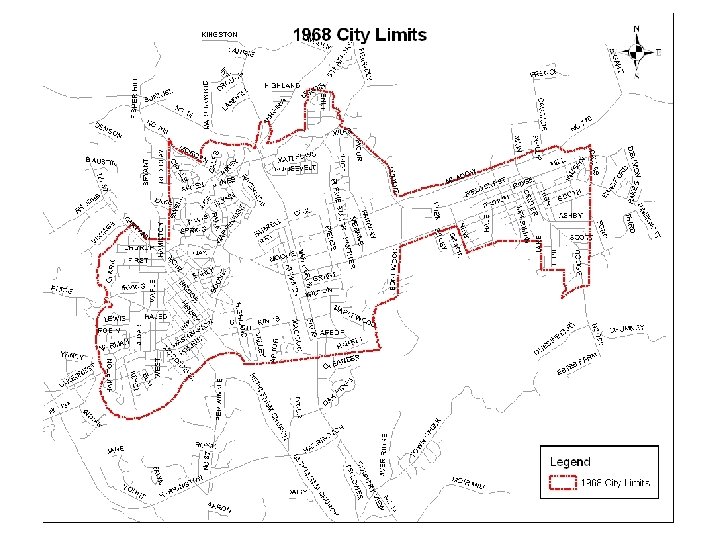
 Annexation Issues in Eden • A History of Annexation in Eden Since 1968 • NC Annexation History • Current Annexation Issues in Eden January 2010


 Treatment Plant Annexation


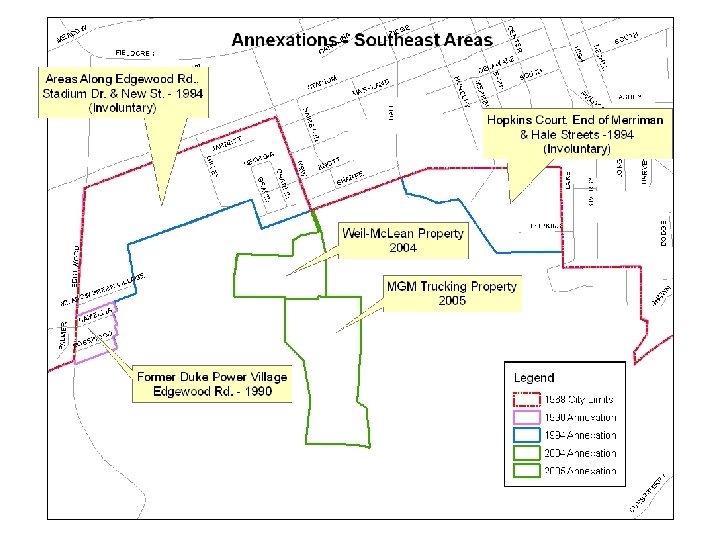
 Voluntary Annexations in Eden • Most annexations in Eden since 1968 have been voluntary. • Property owners request that their property be annexed into the City Limits for a variety of reasons: o Need for City services – water, sewer, police, fire, etc. o Examples – The Oaks, Weil Mc. Lean, MGM Trucking
 Water/Sewer Extension Policy • Except under certain conditions, the City of Eden will provide water and sewer utility services only to properties within the corporate limits of the City and will only allow the extension of such lines to serve properties that are within the corporate limits of the City. No water or sewer service shall be provided to any property outside the corporate limits of the City of Eden unless the owner of the property petitions for voluntary annexation and the City Council approves that annexation prior to their receipt of water and sewer services, or the City Council approves an exception to these sections. • City of Eden City Code Section 16 -211. 1
 Assessment Policy • Property owners desiring extensions of utilities/services may petition the City Council for such extensions or improvements. The minimum area considered shall not be less than an entire street length between intersections and shall extend to the terminus of existing infrastructure. The City Council may decide to increase minimum area requirements based upon the overall size of the area for which new service is required. The property owners will be assessed to recover construction costs based upon N. C. G. S. 160 A-218 and is determined by the assessment maps. • City of Eden City Assessment Policy for Streets, Sidewalks, Water and Sewer Facilities
 Involuntary Annexation in Eden • Several of the same areas have been considered for involuntary annexation by various City Councils multiple times since 1982 Annexation Study Map
 Involuntary Annexation in Eden • Only two involuntary annexations have been completed since that time: 1994 (shown in blue) and 2009 Indian Hills Annexation (shown in green).
 Current Areas Under Consideration for Annexation • Smith Acres and the Bryant Street Area are adjacent to the City Limits and can be undertaken at any time.
 Current Areas Under Consideration for Annexation • The Green Knolls area could be undertaken at any time now that the Indian Hills annexation is effective. • The Meadowood area could only be started after the Smith Acres annexation becomes effective.
 Current Areas Under Consideration for Annexation • The Glen Farm and Sauratown areas have also been considered, but these areas would be more costly and difficult to do.
 Smith Acres Annexation Report Summary
 Smith Acres Annexation Report Summary Rates Effective 2012 -2013 Residential Lots (less than 5 acres) 103 Undeveloped Lots & Lots Over 5 Acres with House 31 Institutional Lots 4 Commercial Lots 6 Total Lots 144 Households: Residential Lots 103 Parcel #133120 (Over 5 Acres with House) 1 Parcel #133167 (Over 5 Acres with House) 1 Parcel #133086 (Over 5 Acres with House) 1 Total Households 106 Population (2. 34 per household) 248
 Smith Acres Annexation Report Summary Rates Effective 2012 -2013 Projected Annual Cost Summary Households Current Sewer Customers Potential New Sewer Customers 113 0 113 Current Sewer Customers x Avg. Monthly Rate ($66. 14) = Lost Sewer Revenue $0 Dan River Water Customers 73 Current City Water Customers 38 Potential New Water Customers 2 Current Water Customers x Avg. Monthly Rate ($62. 16) = Lost Water Revenue $28, 344. 96 Total Water & Sewer Revenue Loss $28, 344. 96
 Smith Acres Annexation Report Summary Rates Effective 2012 -2013 Projected Annual Cost Summary Sanitation ($19. 76 per household per month) $25, 134. 72 Fire Protection (Tax Value x Fire District Rate) $9, 473. 56 Secondary Street Maintenance (2. 27 miles x $3, 663. 77 per mile cost) $8, 316. 76 Street Lights (39 x $5. 47 x 12 months) $2, 559. 96 Total Annual Operating Expenses $73, 829. 96
 Smith Acres Annexation Report Summary Rates Effective 2012 -2013 Projected Annual Revenue Summary Taxes Real Property Taxes (Property Value x Tax Rate x 96% Collectible) $70, 483. 32 Personal Property Taxes (Real Property Taxes x 15%) $10, 572. 50 Sales Tax ($166. 66 per capita) $41, 331. 68 Utilities Franchise Taxes ($47. 05 per capita) $11, 668. 40 Beer & Wine Tax ($4. 50 per capita) $1, 116. 00 Cable Franchise Fee ($10. 18 per capita) $2, 524. 64 Powell Bill Population Based Distribution ($25. 11 per capita) $6, 227. 28 Mileage Based Distribution ($1, 886. 91 x 2. 27 miles) $4, 283. 29 Total Powell Bill Distribution $10, 510. 57
 Smith Acres Annexation Report Summary Rates Effective 2012 -2013 Projected Annual Revenue Summary Water & Sewer Revenue Current Water Customers x $31. 08 monthly $14, 172. 48 New Water Customers x $31. 08 monthly $27, 972. 00 Current Sewer Customers x $33. 97 monthly New Sewer Customers x $33. 07 monthly $0 $44, 842. 92 Total Water & Sewer Revenue $86, 987. 40 Sanitation ($18. 75 per household per month) $23, 850. 00 Total Annual Revenue Summary $259, 044. 51 NET IMPACT (Annual Revenue – Annual Cost) $185, 214. 54
 Smith Acres Annexation Report Summary Rates Effective 2012 -2013 Projected Capital Cost Summary Water Line Extensions & Associated Costs $193, 000. 00 Sewer Line Extensions & Associated Costs $1, 525, 000. 00 Total Water and Sewer Costs Less Water & Sewer Assessments (11, 500 linear ft. x $66. 30 Estimated Cost per Foot) Less Connection Fees (113 Connections x $850 per Tap Fee) $1, 718, 000. 00 $762, 450. 00 $96, 050. 00 Total Assessments & Connection Fees $858, 500. 00 Net Water and Sewer Costs $859, 500. 00 Waste Containers (106 x $49. 50 per Unit) One-time Economic Loss Payment to Private Solid Waste Collector Total Projected Capital Costs Payback Period $5, 247. 00 $18, 555. 30 $883, 302. 30 4. 77 Years
 Bryant Street Area Annexation Report Summary
 Bryant Street Annexation Report Summary Rates Effective 2012 -2013 Residential Lots (less than 5 acres) 162 Undeveloped Lots & Lots Over 5 Acres with House 67 Institutional Lots 5 Commercial Lots 2 Total Lots 236 Households: Residential Lots 162 Parcel #104277 (3 Houses) 2 Parcel #105125 Z 1 (Over 5 Acres with House) 1 Total Households 165 Population (2. 43 per household) 401
 Bryant Street Annexation Report Summary Rates Effective 2012 -2013 Projected Annual Cost Summary Potential New Sewer Customers Current Sewer Customers Total Sewer Customers 118 49 167 Current Sewer Customers x Avg. Monthly Rate ($66. 14) = Lost Sewer Revenue $38, 890. 32 Dan River Water Customers 89 Current City Water Customers 70 Potential New Water Customers 8 Current Water Customers x Avg. Monthly Rate ($62. 16) = Lost Water Revenue $52, 214. 40 Total Water & Sewer Revenue Loss $91, 104. 72 W/S Cost for Part-time Employee Moved to Full-time $23, 009. 28
 Bryant Street Annexation Report Summary Rates Effective 2012 -2013 Projected Annual Cost Summary Sanitation ($19. 76 per household per month) $39, 124. 80 Fire Protection (Tax Value x Fire District Rate) $10, 606. 76 Secondary Street Maintenance (2. 07 miles x $3, 663. 77 per mile cost) $7, 584. 00 Street Lights (55 x $5. 47 x 12 months) $3, 610. 20 Total Annual Operating Expenses $175, 039. 76
 Bryant Street Annexation Report Summary Rates Effective 2012 -2013 Projected Annual Revenue Summary Taxes Real Property Taxes (Property Value x Tax Rate x 96% Collectible) $78, 914. 28 Personal Property Taxes (Real Property Taxes x 15%) $11, 837. 14 Sales Tax ($166. 66 per capita) $66, 830. 66 Utilities Franchise Taxes ($47. 05 per capita) $18, 867. 05 Beer & Wine Tax ($4. 50 per capita) $1, 804. 50 Cable Franchise Fee ($10. 18 per capita) $4, 082. 18 Powell Bill Population Based Distribution ($25. 11 per capita) Mileage Based Distribution ($1, 886. 91 x 2. 07 miles) Total Powell Bill Distribution $10, 069. 11 $3, 905. 90 $13, 975. 01
 Bryant Street Annexation Report Summary Rates Effective 2012 -2013 Projected Annual Revenue Summary Water & Sewer Revenue Current Water Customers x $31. 08 monthly $26, 107. 20 New Water Customers x $31. 08 monthly $36, 177. 12 Current Sewer Customers x $33. 07 monthly $19, 445. 16 New Sewer Customers x $33. 07 monthly $46, 827. 12 Total Water & Sewer Revenue Sanitation ($18. 75 per household per month) $128, 556. 60 $37, 125. 00 Total Annual Revenue Summary $361, 992. 43 NET IMPACT (Annual Revenue – Annual Cost) $186, 952. 67
 Bryant Street Annexation Report Summary Rates Effective 2012 -2013 Projected Capital Cost Summary Water Line Extensions & Associated Costs $501, 000. 00 Sewer Line Extensions & Associated Costs $1, 980, 000. 00 Total Water and Sewer Costs $2, 481, 000. 00 Less Water & Sewer Assessments (14, 300 linear ft. x $69. 23 Estimated Cost per Foot) $989, 989. 00 Less Connection Fees (118 Connections x $850 per Tap Fee) $100, 300. 00 Total Assessments & Connection Fees $1, 090, 289. 00 Net Water and Sewer Costs $1, 390, 711. 00 Waste Containers (165 x $49. 50 per Unit) One-time Economic Loss Payment to Private Solid Waste Collector Total Projected Capital Costs Payback Period $8, 167. 50 $28, 883. 25 $1, 427, 761. 75 7. 64 Years
 Meadowood Annexation Report Summary
") Meadowood Annexation Report Summary Rates Effective 2012 -2013 Residential Lots (less than 5 acres) 119 Undeveloped Lots & Lots Over 5 Acres with House 16 Institutional Lots 2 Commercial Lots 0 Total Lots 137 Households: Residential Lots 119 Total Households 119 Population (2. 34 per household) 278
Meadowood Annexation Report Summary Rates Effective 2012 -2013 Residential Lots (less than 5 acres) 119 Undeveloped Lots & Lots Over 5 Acres with House 16 Institutional Lots 2 Commercial Lots 0 Total Lots 137 Households: Residential Lots 119 Total Households 119 Population (2. 34 per household) 278
 Meadowood Annexation Report Summary Rates Effective 2012 -2013 Projected Annual Cost Summary Potential New Sewer Customers Current Sewer Customers Total Sewer Customers 119 0 119 Current Sewer Customers x Avg. Monthly Rate ($66. 14) = Lost Sewer Revenue Dan River Water Customers Current City Water Customers $0 120 0 Dan River Water Customers x Monthly Bill = Amount to Compensate DRW $0 Total Water & Sewer Revenue Loss $0
 Meadowood Annexation Report Summary Rates Effective 2012 -2013 Projected Annual Cost Summary Sanitation ($19. 76 per household per month) $28, 217. 28 Fire Protection (Tax Value x Fire District Rate) $9, 420. 20 Secondary Street Maintenance (1. 57 miles x $3, 663. 77 per mile cost) $5, 752. 12 Street Lights (21 x $5. 47 x 12 months) $1, 378. 44 Total Annual Operating Expenses $44, 768. 04
 Meadowood Annexation Report Summary Rates Effective 2012 -2013 Projected Annual Revenue Summary Taxes Real Property Taxes (Property Value x Tax Rate x 96% Collectible) $70, 086. 32 Personal Property Taxes (Real Property Taxes x 15%) $10, 512. 95 Sales Tax ($166. 66 per capita) $46, 331. 48 Utilities Franchise Taxes ($47. 05 per capita) $13, 079. 90 Beer & Wine Tax ($4. 50 per capita) $1, 251. 00 Cable Franchise Fee ($10. 18 per capita) $2, 830. 04 Powell Bill Population Based Distribution ($25. 11 per capita) $6, 980. 58 Mileage Based Distribution ($1, 886. 91 x 1. 57 miles) $2, 962. 45 Total Powell Bill Distribution $9, 943. 03
 Meadowood Annexation Report Summary Rates Effective 2012 -2013 Projected Annual Revenue Summary Water & Sewer Revenue New Water Customers x $31. 08 monthly $44, 755. 20 New Sewer Customers x $33. 07 monthly $47, 620. 80 Total Water & Sewer Revenue $92, 376. 00 Sanitation ($18. 75 per household per month) $26, 755. 00 Total Annual Revenue Summary $273, 185. 71 NET IMPACT (Annual Revenue – Annual Cost) $228, 417. 67
 Meadowood Annexation Report Summary Rates Effective 2012 -2013 Projected Capital Cost Summary Water Line Extensions & Associated Costs $262, 000. 00 Sewer Line Extensions & Associated Costs $2, 229, 000. 00 Total Water and Sewer Costs Less Water & Sewer Assessments (15, 000 linear ft. x $71. 44 Estimated Cost per Foot) Less Connection Fees (120 Connections x $850 per Tap Fee) $2, 491, 000. 00 $1, 071, 600. 00 $102, 000. 00 Total Assessments & Connection Fees $1, 173, 600. 00 Net Water and Sewer Costs $1, 317, 400. 00 Waste Containers (119 x $49. 50 per Unit) One-time Economic Loss Payment to Private Solid Waste Collector Total Projected Capital Costs Payback Period $5, 890. 50 $20, 830. 95 $1, 344, 121. 45 5. 88 Years
 Green Knolls Annexation Report Summary
 Green Knolls Annexation Report Summary Rates Effective 2012 -2013 Residential Lots (less than 5 acres) 71 Undeveloped Lots & Lots Over 5 Acres with House 13 Institutional Lots 0 Commercial Lots 1 Total Lots 85 Households: Residential Lots 71 Parcel #133454 (Over 5 Acres with House) 1 Total Households 72 Population (2. 34 per household) 171
 Green Knolls Annexation Report Summary Rates Effective 2012 -2013 Projected Annual Cost Summary Households Current Sewer Customers Potential New Sewer Customers 72 0 72 Current Sewer Customers x Avg. Monthly Rate ($66. 14) = Lost Sewer Revenue Dan River Water Customers $0 69 Current City Water Customers 0 Potential New Water Customers 3 Dan River Water Customers x Monthly Bill = Amount to Compensate DRW $0 Total Water & Sewer Revenue Loss $0
 Green Knolls Annexation Report Summary Rates Effective 2012 -2013 Projected Annual Cost Summary Sanitation ($19. 76 per household per month) $17, 072. 64 Fire Protection (Tax Value x Fire District Rate) $6, 006. 18 Secondary Street Maintenance (1. 07 miles x $3, 663. 77 per mile cost) $3, 920. 23 Street Lights (22 x $5. 47 x 12 months) $1, 444. 08 Total Annual Operating Expenses $28, 443. 14
 Green Knolls Annexation Report Summary Rates Effective 2012 -2013 Projected Annual Revenue Summary Taxes Real Property Taxes (Property Value x Tax Rate x 96% Collectible) $44, 685. 99 Personal Property Taxes (Real Property Taxes x 15%) $6, 702. 90 Sales Tax ($166. 66 per capita) $28, 498. 86 Utilities Franchise Taxes ($47. 05 per capita) $8, 045. 55 Beer & Wine Tax ($4. 50 per capita) $769. 50 Cable Franchise Fee ($10. 18 per capita) $1, 740. 78 Powell Bill Population Based Distribution ($25. 11 per capita) $4, 293. 81 Mileage Based Distribution ($1, 886. 91 x 1. 07 miles) $2, 018. 99 Total Powell Bill Distribution $6, 312. 80
 Green Knolls Annexation Report Summary Rates Effective 2012 -2013 Projected Annual Revenue Summary Water & Sewer Revenue New Water Customers x $31. 08 monthly $26, 853. 12 New Sewer Customers x $33. 07 monthly $28, 572. 48 Total Water & Sewer Revenue $55, 425. 60 Sanitation ($18. 75 per household per month) $16, 200. 00 Total Annual Revenue Summary $168, 381. 98 NET IMPACT (Annual Revenue – Annual Cost) $139, 938. 85
 Green Knolls Annexation Report Summary Rates Effective 2012 -2013 Projected Capital Cost Summary Water Line Extensions & Associated Costs $223, 000. 00 Sewer Line Extensions & Associated Costs $1, 728, 000. 00 Total Water and Sewer Costs Less Water & Sewer Assessments (10, 400 linear ft. x $83. 07 Estimated Cost per Foot) Less Connection Fees (72 Connections x $850 per Tap Fee) Total Assessments & Connection Fees Net Water and Sewer Costs Waste Containers (72 x $49. 50 per Unit) One-time Economic Loss Payment to Private Solid Waste Collector Total Projected Capital Costs Payback Period $1, 951, 000. 00 $863, 928. 00 $61, 200. 00 $925, 128. 00 $1, 025, 872. 00 $3, 564. 00 $12, 603. 60 $1, 042, 039. 60 7. 45 Years
 Western Areas Annexation Report Summary
 Western Areas Annexation Report Summary Rates Effective 2012 -2013 Residential Lots (less than 5 acres) 293 Undeveloped Lots & Lots Over 5 Acres with House 61 Institutional Lots 6 Commercial Lots 7 Total Lots 367 Households: Residential Lots 293 Parcel #133454 (Over 5 Acres with House) 1 Parcel #133120 (Over 5 Acres with House) 1 Parcel #133167 (Over 5 Acres with House) 1 Parcel #133086 (Over 5 Acres with House) 1 Parcel #132733 (Over 5 Acres with House) 1 Total Households 298 Population (2. 34 per household) 697
 Western Areas Annexation Report Summary Rates Effective 2012 -2013 Projected Annual Cost Summary Households Current Sewer Customers Potential New Sewer Customers 298 0 298 Current Sewer Customers x Avg. Monthly Rate ($66. 14) = Lost Sewer Revenue Dan River Water Customers Current City Water Customers Potential New Water Customers $0 262 38 5 Dan River Water Customers x Monthly Bill = Amount to Compensate DRW $0 Total Water & Sewer Revenue Loss $0
 Western Areas Annexation Report Summary Rates Effective 2012 -2013 Projected Annual Cost Summary Sanitation ($19. 76 per household per month) $70, 661. 76 Fire Protection (Tax Value x Fire District Rate) $25, 459. 76 Secondary Street Maintenance (4. 91 miles x $3, 663. 77 per mile cost) $17, 989. 11 Street Lights (82 x $5. 47 x 12 months) $5, 382. 48 Total Annual Operating Expenses $119, 493. 11
 Western Areas Annexation Report Summary Rates Effective 2012 -2013 Projected Annual Revenue Summary Taxes Real Property Taxes (Property Value x Tax Rate x 96% Collectible) $189, 420. 64 Personal Property Taxes (Real Property Taxes x 15%) $28, 413. 10 Sales Tax ($166. 66 per capita) $116, 162. 02 Utilities Franchise Taxes ($47. 05 per capita) $32, 793. 85 Beer & Wine Tax ($4. 50 per capita) $3, 136. 50 Cable Franchise Fee ($10. 18 per capita) $7, 095. 46 Powell Bill Population Based Distribution ($25. 11 per capita) Mileage Based Distribution ($1, 886. 91 x 1. 07 miles) Total Powell Bill Distribution $17, 501. 67 $9, 264. 73 $26, 766. 40
 Western Areas Annexation Report Summary Rates Effective 2012 -2013 Projected Annual Revenue Summary Water & Sewer Revenue Current Water Customers x $31. 08 monthly $14, 172. 48 New Water Customers x $31. 08 monthly $99, 580. 32 New Sewer Customers x $33. 07 monthly $118, 258. 32 Total Water & Sewer Revenue Sanitation ($18. 75 per household per month) $232, 011. 12 $67, 050. 00 Total Annual Revenue Summary $702, 849. 09 NET IMPACT (Annual Revenue – Annual Cost) $583, 355. 97
 Western Areas Annexation Report Summary Rates Effective 2012 -2013 Projected Capital Cost Summary Water Line Extensions & Associated Costs $678, 000. 00 Sewer Line Extensions & Associated Costs $5, 482, 000. 00 Total Water and Sewer Costs $6, 160, 000. 00 Water & Sewer Assessments (15, 000 linear ft. x $71. 44 est. cost/ft - Meadowood) $1, 071, 600. 00 Water & Sewer Assessments (10, 400 linear ft. x $83. 07 est. cost/ft – Green Knolls) $863, 928. 00 Water & Sewer Assessments (11, 500 linear ft. x $66. 30 est. cost/ft – Smith Acres) $762, 450. 00 Sewer Conn. Fees (120 x $850 - Meadowood) $102, 000. 00 Sewer Conn. Fees (72 x $850 – Green Knolls) $61, 200. 00 Sewer Conn. Fees (113 x $850 – Smith Acres) $96, 050. 00 Total Assessments & Connection Fees $2, 957, 288. 00 Net Water and Sewer Costs $3, 202, 772. 00
 Western Areas Annexation Report Summary Rates Effective 2012 -2013 Projected Capital Cost Summary Waste Containers (298 x $49. 50 per Unit) $14, 751. 00 One-time Economic Loss Payment to Private Solid Waste Collector $52, 164. 90 Total Projected Capital Costs Payback Period $3, 269, 687. 90 5. 60 Years
 Glen Farm Area Annexation Report Summary
 Glen Farm Area Annexation Report Summary Rates Effective 2012 -2013 Residential Lots (less than 5 acres) 96 Undeveloped Lots & Lots Over 5 Acres with House 56 Institutional Lots 1 Commercial Lots 2 Total Lots 155 Households: Residential Lots 96 Parcel #140932 1 Total Households 97 Population (2. 34 per household) 227
 Glen Farm Area Annexation Report Summary Rates Effective 2012 -2013 Projected Annual Cost Summary Current Sewer Customers Potential New Sewer Customers 0 97 Current Sewer Customers x Avg. Monthly Rate ($66. 14) = Lost Sewer Revenue Dan River Water Customers Current City Water Customers Potential New Water Customers $0 97 Dan River Water Customers x Monthly Bill = Amount to Compensate DRW $0 Total Water & Sewer Revenue Loss $0
 Glen Farm Area Annexation Report Summary Rates Effective 2012 -2013 Projected Annual Cost Summary Sanitation ($19. 76 per household per month) $23, 000. 64 Fire Protection (Tax Value x Fire District Rate) $17, 169. 40 Secondary Street Maintenance (2. 17 miles x $3, 663. 77 per mile cost) $7, 950. 38 Street Lights (73 x $5. 47 x 12 months) $4, 791. 72 Total Annual Operating Expenses $52, 912. 14
 Glen Farm Area Annexation Report Summary Rates Effective 2012 -2013 Projected Annual Revenue Summary Taxes Real Property Taxes (Property Value x Tax Rate x 96% Collectible) $127, 740. 35 Personal Property Taxes (Real Property Taxes x 15%) $19, 161. 05 Sales Tax ($166. 66 per capita) $37, 828. 49 Utilities Franchise Taxes ($47. 05 per capita) $10, 679. 41 Beer & Wine Tax ($4. 50 per capita) $1, 021. 41 Cable Franchise Fee ($10. 18 per capita) $2, 310. 66 Powell Bill Population Based Distribution ($25. 11 per capita) $5, 699. 47 Mileage Based Distribution ($1, 886. 91 x 1. 57 miles) $2, 962. 45 Total Powell Bill Distribution $8, 661. 92
 Glen Farm Area Annexation Report Summary Rates Effective 2012 -2013 Projected Annual Revenue Summary Water & Sewer Revenue New Water Customers x $31. 08 monthly $36, 177. 12 New Sewer Customers x $33. 07 monthly $38, 493. 48 Total Water & Sewer Revenue $74, 670. 60 Sanitation ($18. 75 per household per month) $21, 825. 00 Total Annual Revenue Summary $303, 898. 89 NET IMPACT (Annual Revenue – Annual Cost) $250, 986. 74
 Glen Farm Area Annexation Report Summary Rates Effective 2012 -2013 Projected Capital Cost Summary Water Line Extensions & Associated Costs $250, 000. 00 Sewer Line Extensions & Associated Costs $2, 690, 000. 00 Sewer Line Extensions & Associated Costs for East & West Sides of NC 14 $994, 000. 00 Total Water and Sewer Costs Less Water & Sewer Assessments (15, 800 linear ft. x $84. 49 Estimated Cost per Foot) Less Water Connection Fees (97 Connections x $850 per Tap Fee) $3, 934, 000. 00 $1, 334, 942. 00 $82, 450. 00 Total Assessments & Connection Fees $1, 417, 392. 00 Net Water and Sewer Costs $2, 516, 608. 00
 Glen Farm Area Annexation Report Summary Rates Effective 2012 -2013 Projected Capital Cost Summary Waste Containers (97 x $49. 50 per Unit) One-time Economic Loss Payment to Private Solid Waste Collector Total Projected Capital Costs Payback Period $4, 801. 50 $16, 979. 85 $2, 538, 389. 35 10. 11 Years
 Sauratown Area Annexation Report Summary
 Sauratown Area Annexation Report Summary Rates Effective 2012 -2013 Residential Lots (less than 5 acres) 27 Undeveloped Lots & Lots Over 5 Acres with House 17 Institutional Lots 0 Commercial Lots 0 Total Lots 44 Households: Residential Lots 27 Parcel #166414 (Over 5 Acres with House) 1 Total Households 28 Population (2. 34 per household) 66
 Sauratown Area Annexation Report Summary Rates Effective 2012 -2013 Projected Annual Cost Summary Current Sewer Customers Potential New Sewer Customers 0 28 Current Sewer Customers x Avg. Monthly Rate ($66. 14) = Lost Sewer Revenue Dan River Water Customers Current City Water Customers Potential New Water Customers $0 28 Dan River Water Customers x Monthly Bill = Amount to Compensate DRW $0 Total Water & Sewer Revenue Loss $0
 Sauratown Area Annexation Report Summary Rates Effective 2012 -2013 Projected Annual Cost Summary Sanitation ($19. 76 per household per month) $6, 639. 36 Fire Protection (Tax Value x Fire District Rate) $4, 146. 90 Secondary Street Maintenance (1. 33 miles x $3, 663. 77 per mile cost) $4, 872. 81 Street Lights (24 x $5. 47 x 12 months) $1, 575. 36 Total Annual Operating Expenses $17, 234. 43
 Sauratown Area Annexation Report Summary Rates Effective 2012 -2013 Projected Annual Revenue Summary Taxes Real Property Taxes (Property Value x Tax Rate x 96% Collectible) $30, 852. 92 Personal Property Taxes (Real Property Taxes x 15%) $4, 627. 94 Sales Tax ($166. 66 per capita) $10, 919. 56 Utilities Franchise Taxes ($47. 05 per capita) $10, 679. 41 Beer & Wine Tax ($4. 50 per capita) $294. 84 Cable Franchise Fee ($10. 18 per capita) $666. 99 Powell Bill Population Based Distribution ($25. 11 per capita) $1, 645. 21 Mileage Based Distribution ($1, 886. 91 x 1. 57 miles) $2, 509. 59 Total Powell Bill Distribution $4, 154. 80
 Sauratown Area Annexation Report Summary Rates Effective 2012 -2013 Projected Annual Revenue Summary Water & Sewer Revenue New Water Customers x $31. 08 monthly $10, 442. 88 New Sewer Customers x $33. 07 monthly $11, 111. 52 Total Water & Sewer Revenue Sanitation ($18. 75 per household per month) $21, 554. 40 $6, 300. 00 Total Annual Revenue Summary $82, 454. 17 NET IMPACT (Annual Revenue – Annual Cost) $65, 219. 74
 Sauratown Area Annexation Report Summary Rates Effective 2012 -2013 Projected Capital Cost Summary Water Line Extensions & Associated Costs $58, 000. 00 Sewer Line Extensions & Associated Costs $1, 857, 000. 00 Total Water and Sewer Costs Less Water & Sewer Assessments (15, 000 linear ft. x $61. 90 Estimated Cost per Foot) Less Water Connection Fees (28 Connections x $850 per Tap Fee) $1, 915, 000. 00 $928, 500. 00 $23, 800. 00 Total Assessments & Connection Fees $952, 300. 00 Net Water and Sewer Costs $962, 700. 00
 Sauratown Area Annexation Report Summary Rates Effective 2012 -2013 Projected Capital Cost Summary Waste Containers (28 x $49. 50 per Unit) $1, 386. 00 One-time Economic Loss Payment to Private Solid Waste Collector $4, 901. 40 Total Projected Capital Costs $968, 987. 40 Payback Period 14. 86 Years
 Recommendations • Review all industrial sites outside the City Limits but within the ETJ for feasibility of annexation, with particular focus on the Hanesbrands property. • Update Resolution of Consideration in February 2010. • Financial constraints: o Current economic conditions in the City, County, State & Nation are not very stable. o Water & Sewer Fund is adjusting to changes from the loss of Hanesbrands and others. o General Fund revenues are unpredictable at this time. • Therefore, Staff recommends: o No annexations be initiated in 2010, but that a small area be considered for 2011. o A plan for regular annexations be considered by Council.