
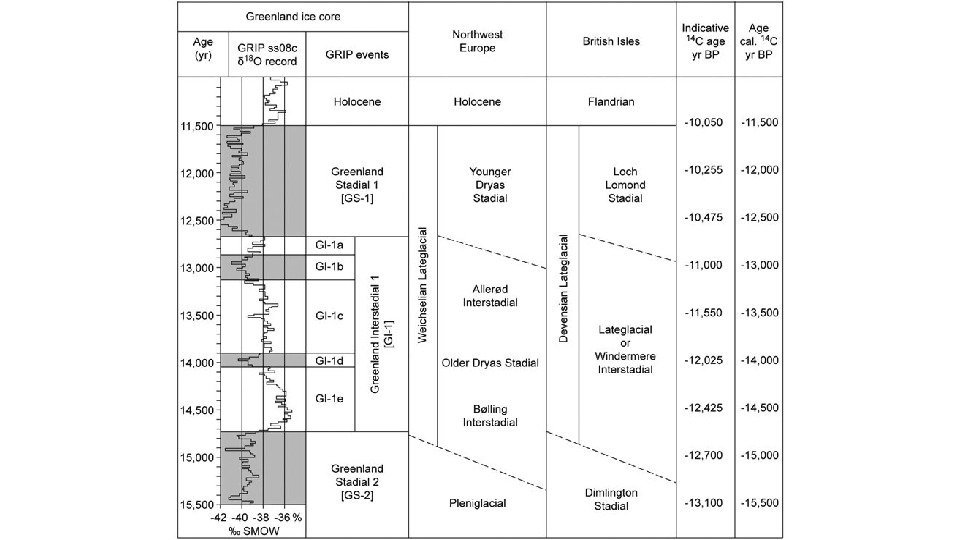
a) Variations in eustatic sea level (with 1σ

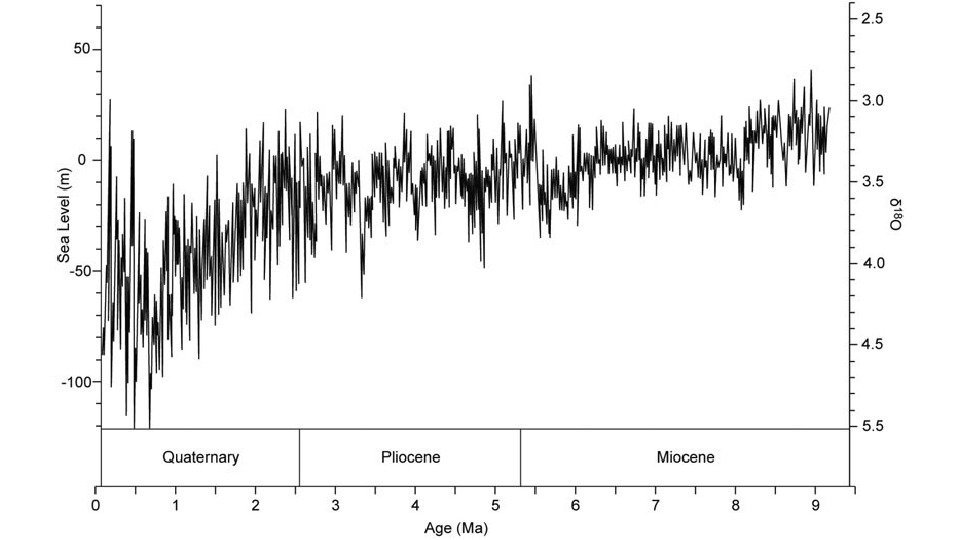
 Variations in eustatic sea level (with 1σ confidence limits shown in grey shading)")


 enlargement of the subsection in Fig. 1")


 Пресноводные моллюски")


 time")
3.pptx
- Размер: 36.4 Мб
- Автор:
- Количество слайдов: 74
Описание презентации a) Variations in eustatic sea level (with 1σ по слайдам
a) Variations in eustatic sea level (with 1σ confidence limits shown in grey shading) over the past 1 Ma based on ice-volume changes reflected in marine oxygen isotope records. b) The sea-level record for the last 500 ka compared with independent isotopic measurements from the Red Sea basin (white circles) and from coral reef data from New Guinea and Barbados (black circles) (from Bintanja et al. , 2005).
Литологические индикаторы Литолого-фациальный анализ Гранулометрия Форма частиц Характер поверхности кварцевых зерен Содержание не органических хим. Элементов Содержание органических хим. Элементов Глинистые минералы Магнитная восприимчивость Содержание тяжелых минералов Анализ стабильных изотопов
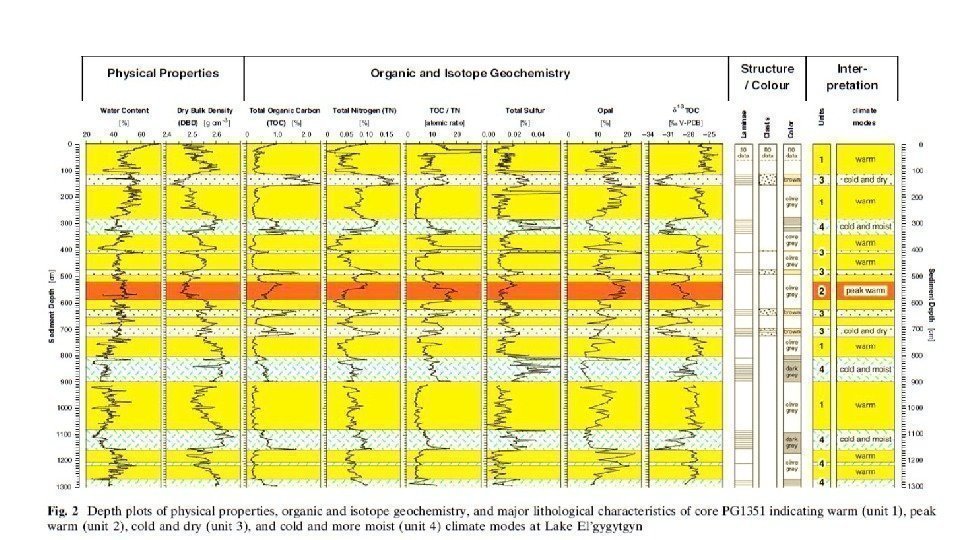
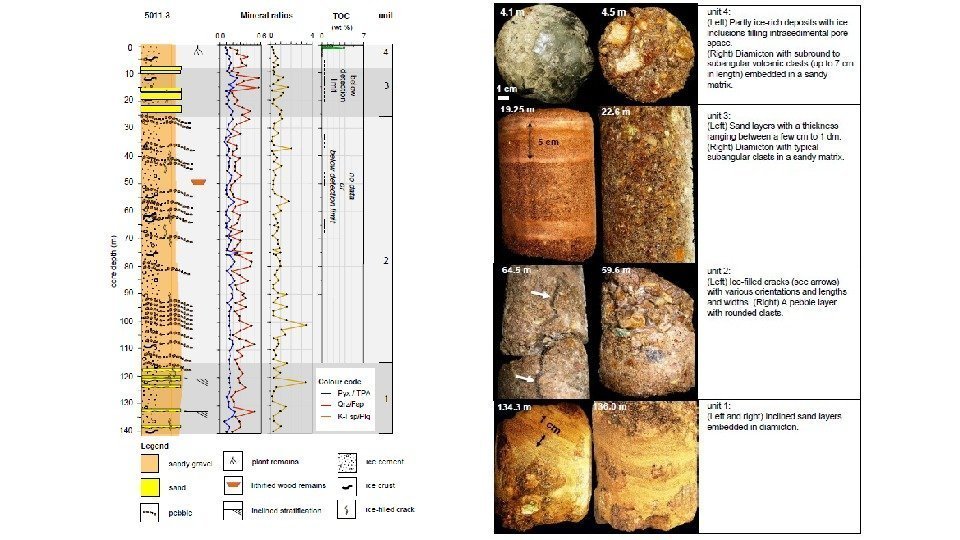
Озерные отложения Examples of X-radiographs and line-scan pictures from lithological facies occurring in the pelagic sediment record from ICDP Site 5011 -1. Facies A is characteristic for glacials/stadials with perennial ice cover, Facies B reflects a wide range of climates with seasonal ice cover, and Facies C suggests very pronounced interglacials with seasonal ice cover and an exceptionally high primary production.
Болотные отложения
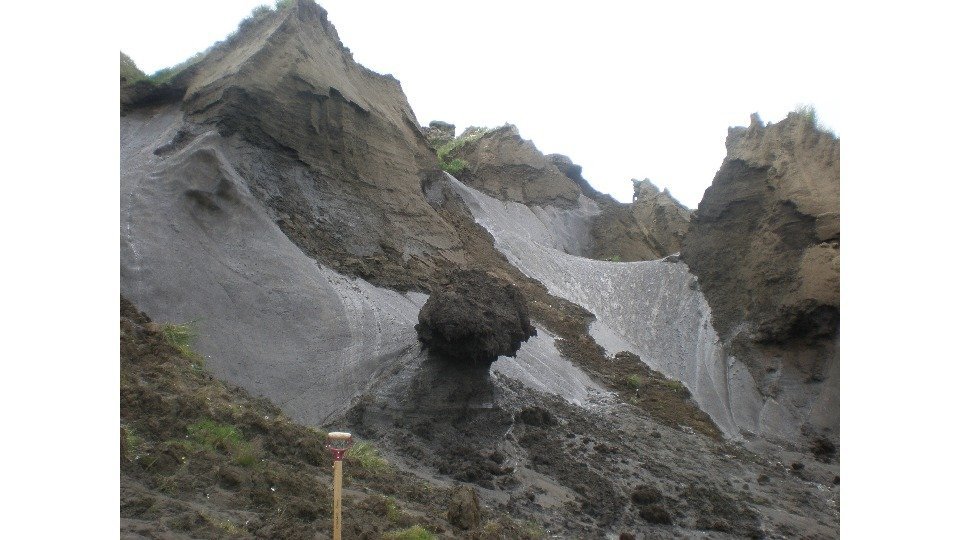
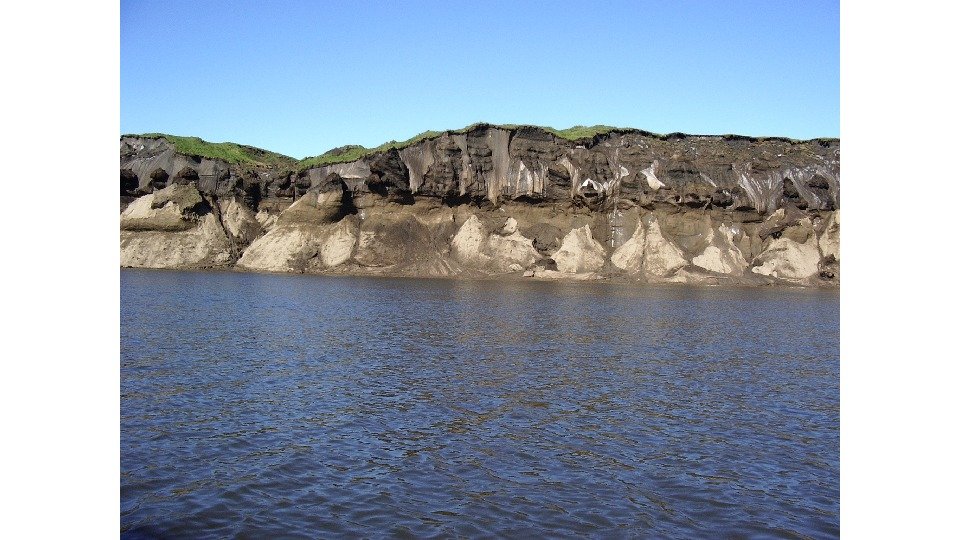
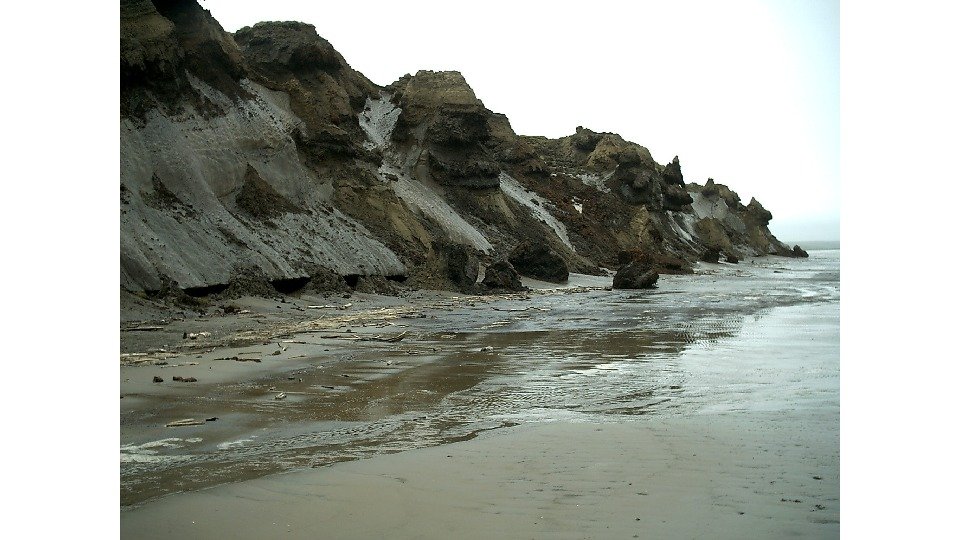
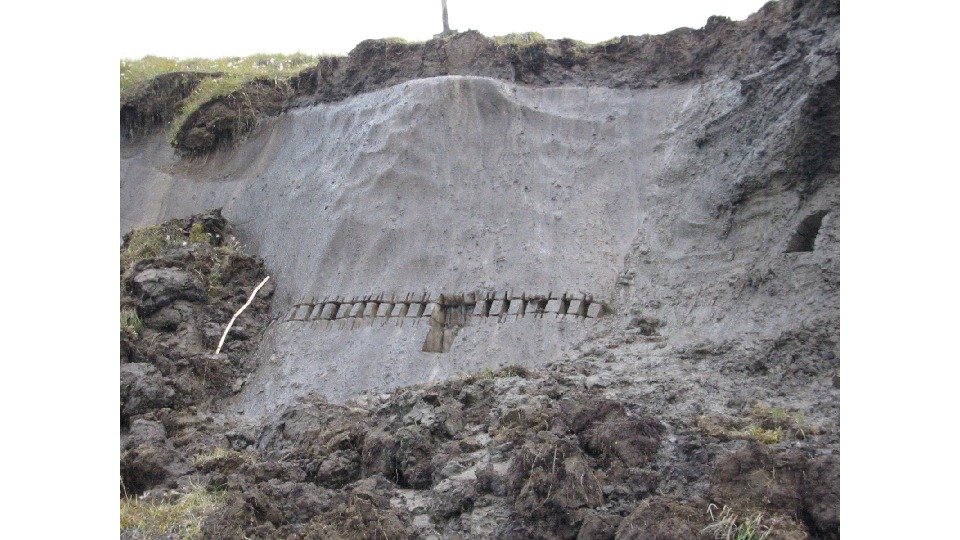
Отложения перигляциальной зоны
Classification of cryoturbation structures according to their form (symmetry, amplitude, wavelength and pattern of occurrence) (based on Vandenberghe, 1988, after Ballantyne & Harris, 1994).
Флювиальные отложения
Topography of the fan surface: (a) enlargement of the subsection in Fig. 1 b. Positions of cross profiles 1, 2, and 3 and a radial cross section A–A’ running across the fan delta through the 5011 -3 permafrost drill site. The faint dotted line indicates the subaquatic fan prolongation. The delta margin might have been partially flooded after a lake level rise (Image source: USGS, CORONA 1216 -5, acquisition date: 14 September 1980). (b) Longitudinal profile across the drill site. (c) Cross profiles 1, 2, and 3.
Погребенные почвы
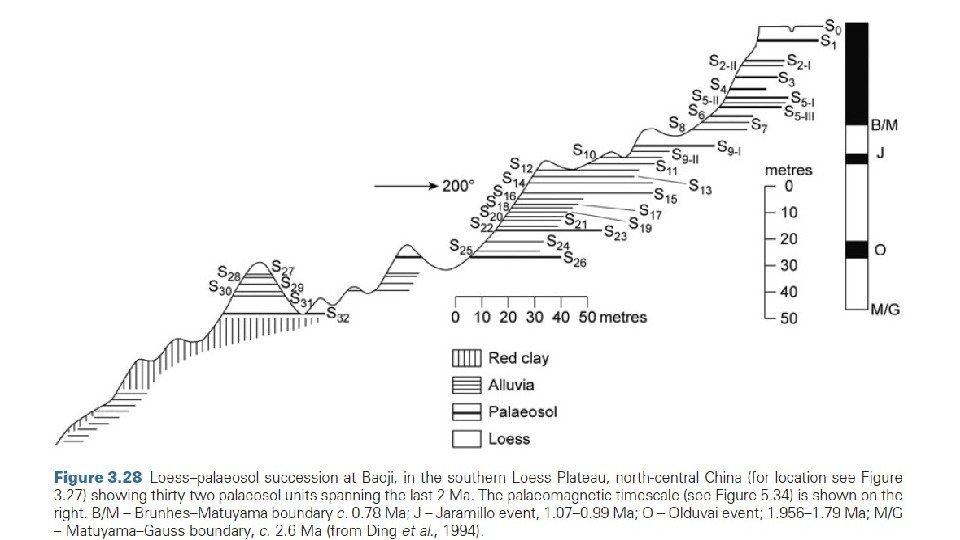
Лессы
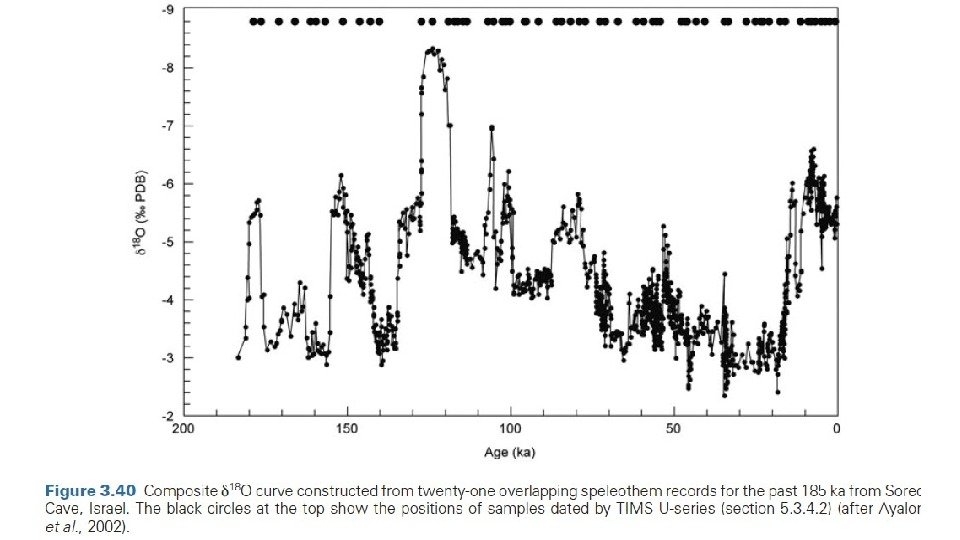
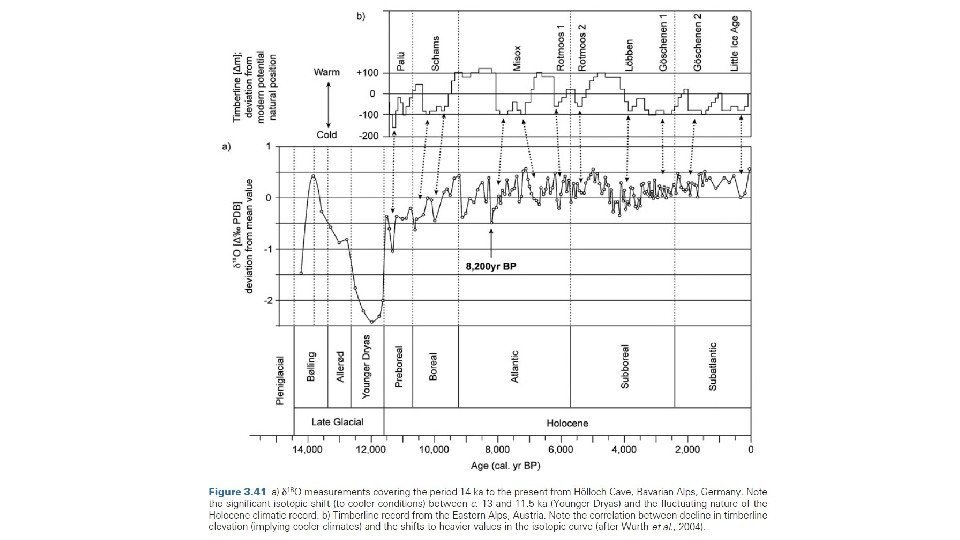
Спелиотемы и Травертины
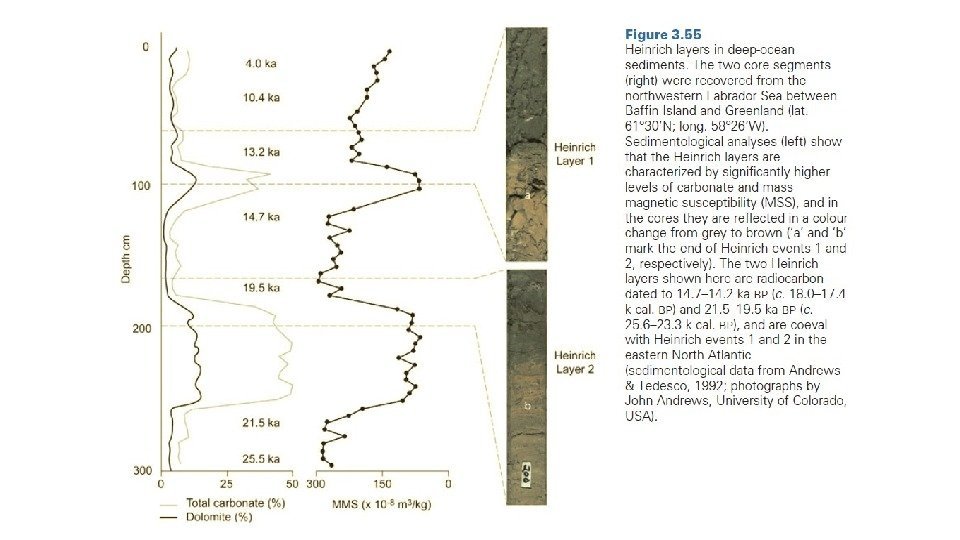
Морские отложения Содержание терригенного материала Колебания уровня Океана Ледовый разнос
Изотопы углерода 13 С и 12 С
Ледовые керны
• Толщина годовых слоев • Аэрозоли, пыль • Газовый состав (углекислый газ и метан) • Стабильные изотопы кислорода и углерода
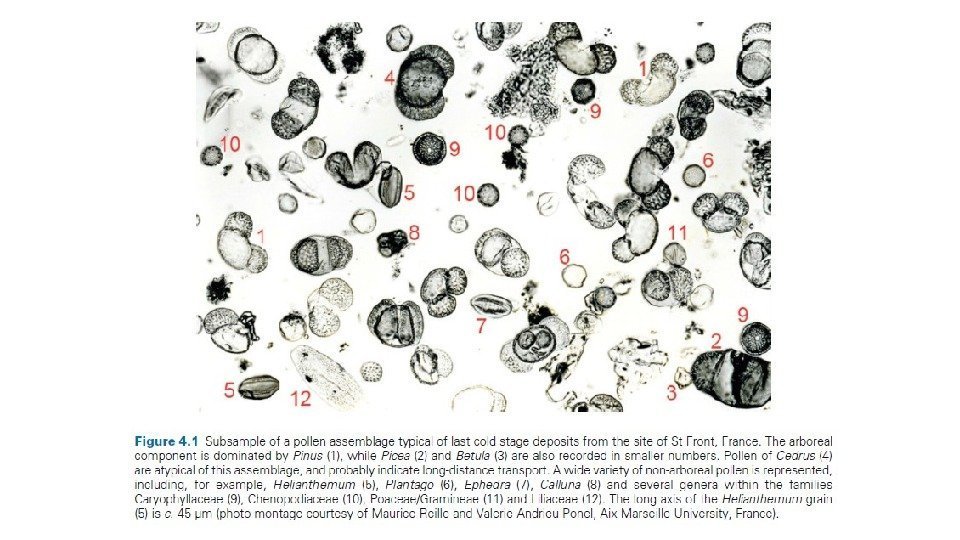
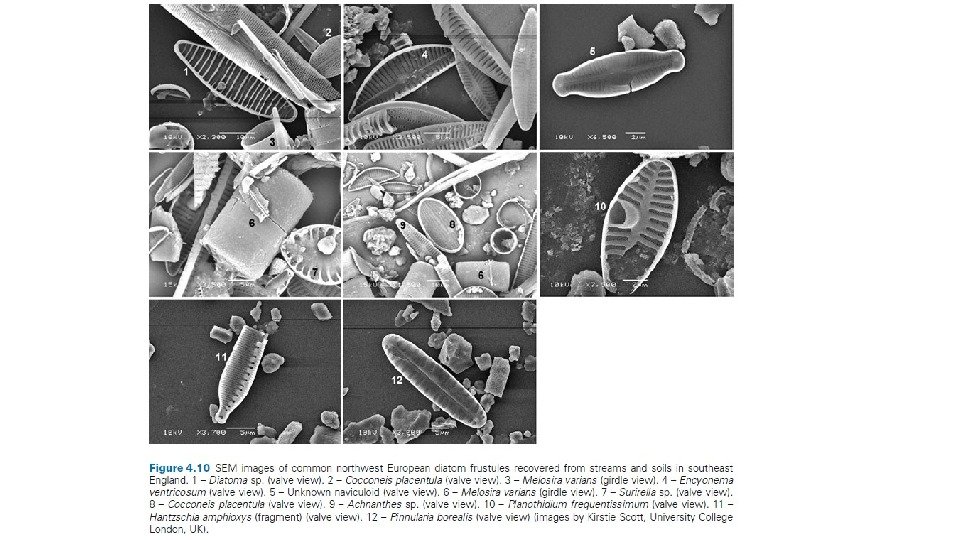
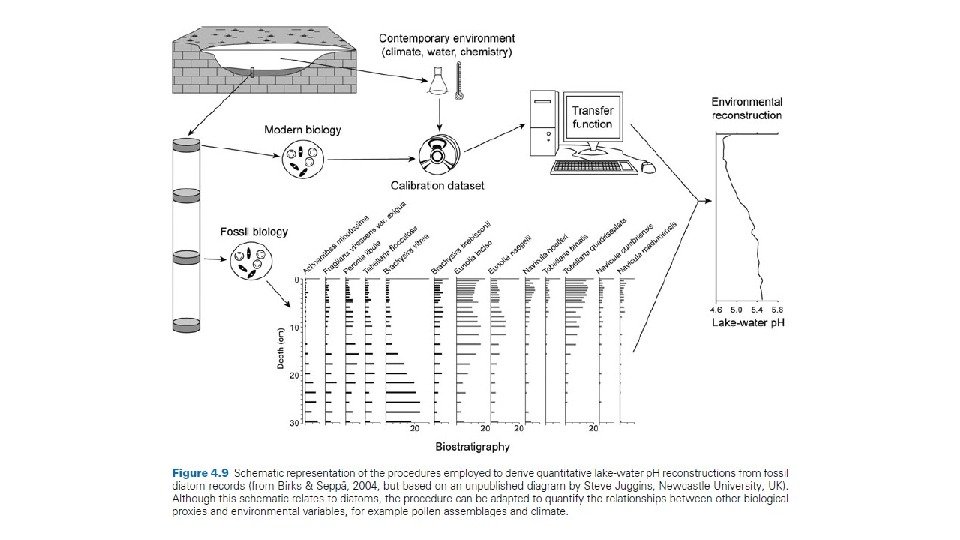
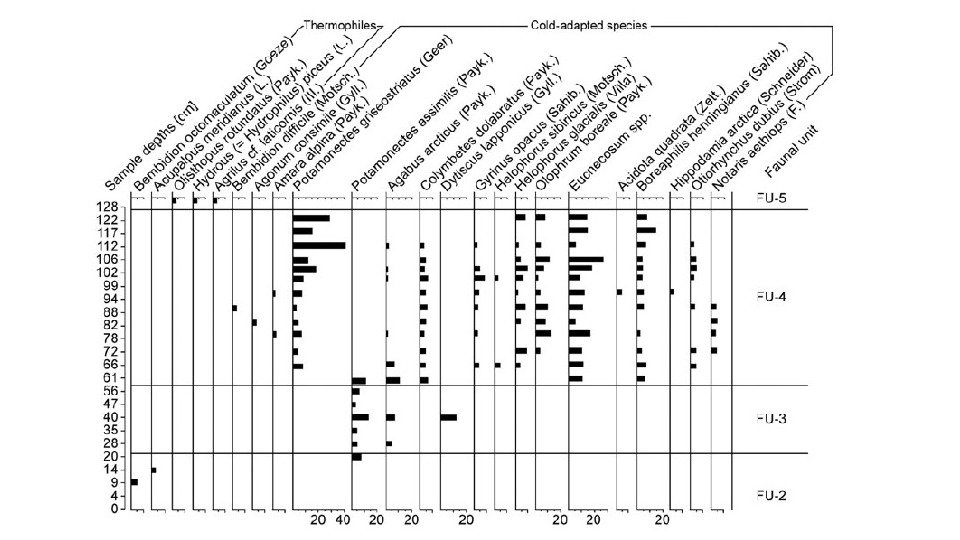
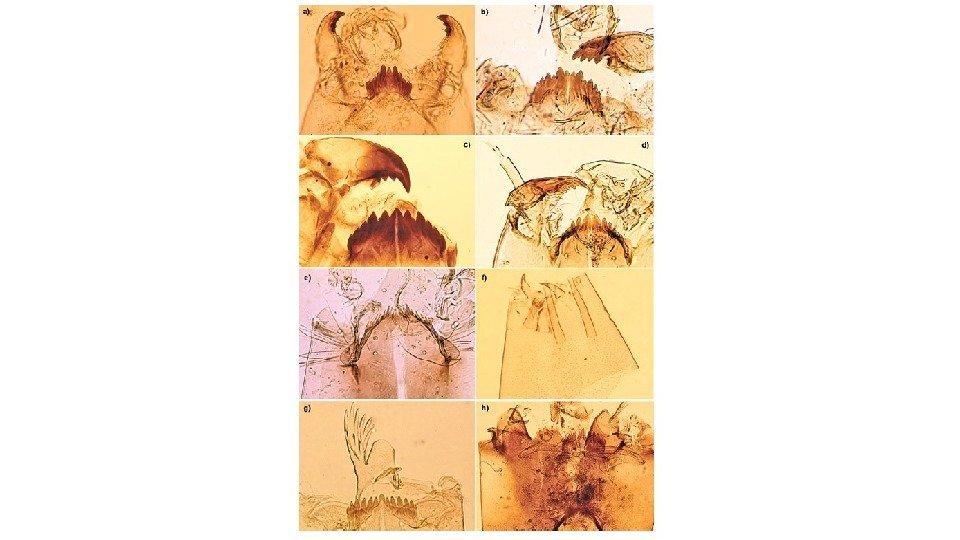
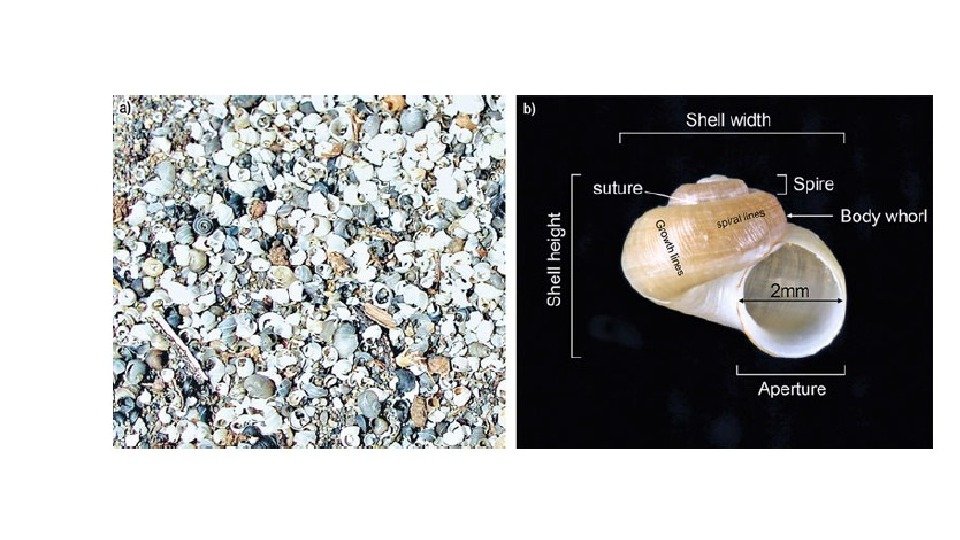
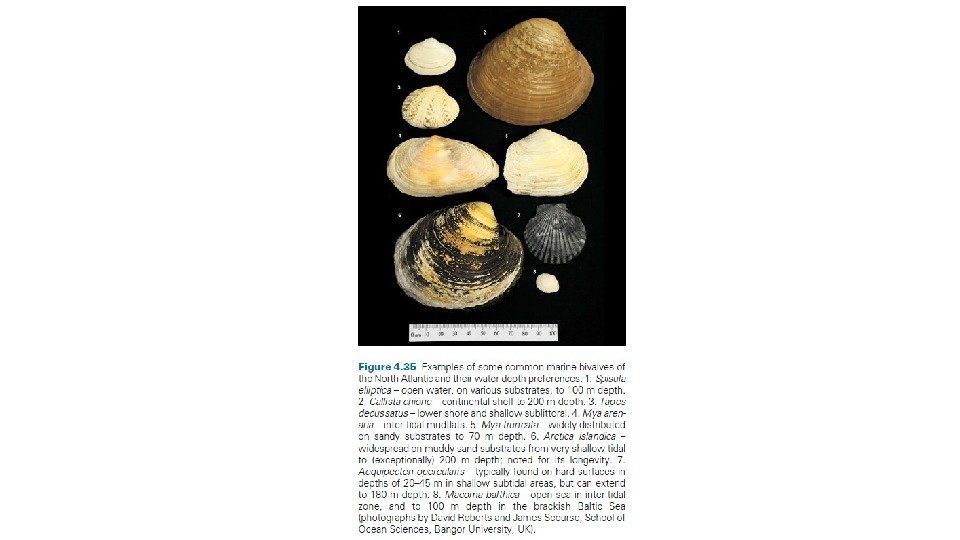
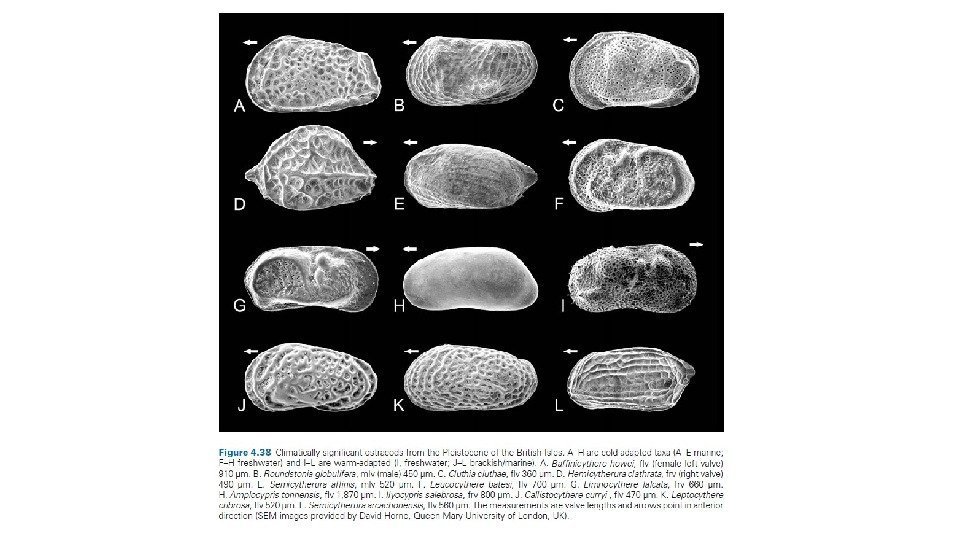
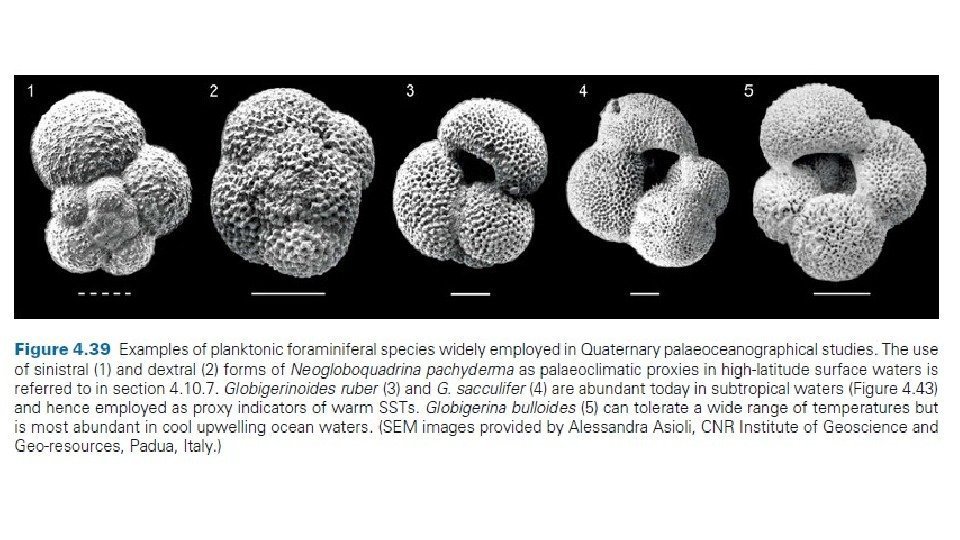
Биологические индикаторы Спорово-пыльцевой метод Диатомовый метод Растительные макроостатки Насекомые (Caleoptera-жуки, Chironomidae-комары звонцы) Пресноводные моллюски Морские моллюски Остракоды Фораминиферы Радиолярии Динофлагиляты Остатки позвоночных Биомаркеры (молекулы) ДНК Метод современных аналогов
Map of modern vegetation of the Laptev Sea Region /Atlas of the Arctic, 1985/ Severnaya Zemlya Archipelago Kotel`ny Island Central and Northern Taimyr Lowland Putorana Plateau Lena Delta. L A P T E V S E A h i g h a r t i c t u n d r a n o r t h e r n t u n d r a h i g h a r t i c t u n d r as o u t h e r n t u n d r a f o r e s t — t u n d r a m o u n t i n g t u n d r a V e g e t a t i o n t y p e s : — c r o s s s e c t i o n s s a m p l e d a n a l y s e d b y a u t h o r s a n d o t h e r i n v e s t i g a t o r s
Climate oscillations in the Laptev Sea Region during the Holocene
Map of vegetation of the Laptev Sea Region for 11 -10 ka. Areas covered by different types of glaciers and dead ice. L A P T E V S
Map of vegetation of the Laptev Sea Region for 10 -9 ka. L A P T E V S
Map of vegetation of the Laptev Sea Region for 8 -7 ka. L A P T E V S
Map of vegetation of the Laptev Sea Region for 7 -6 ka. L A P T E V S
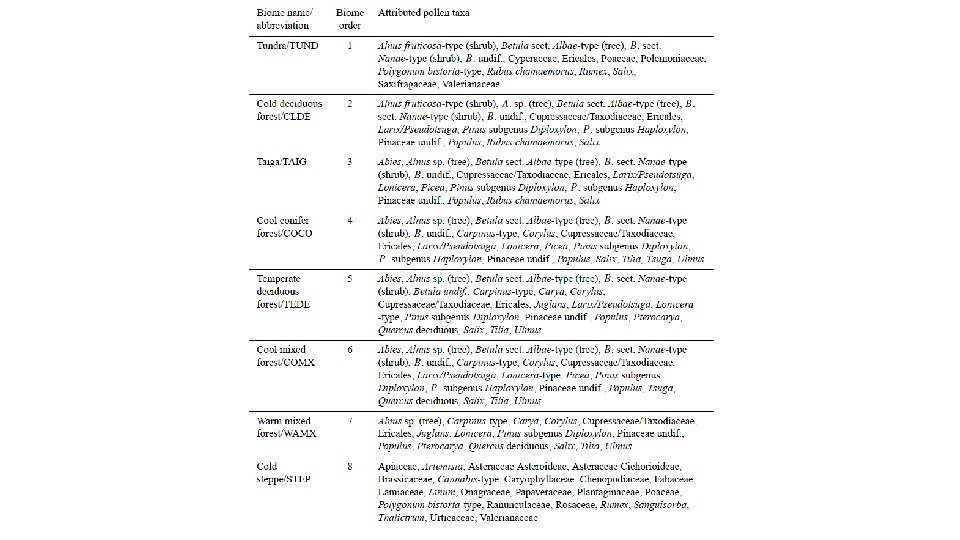
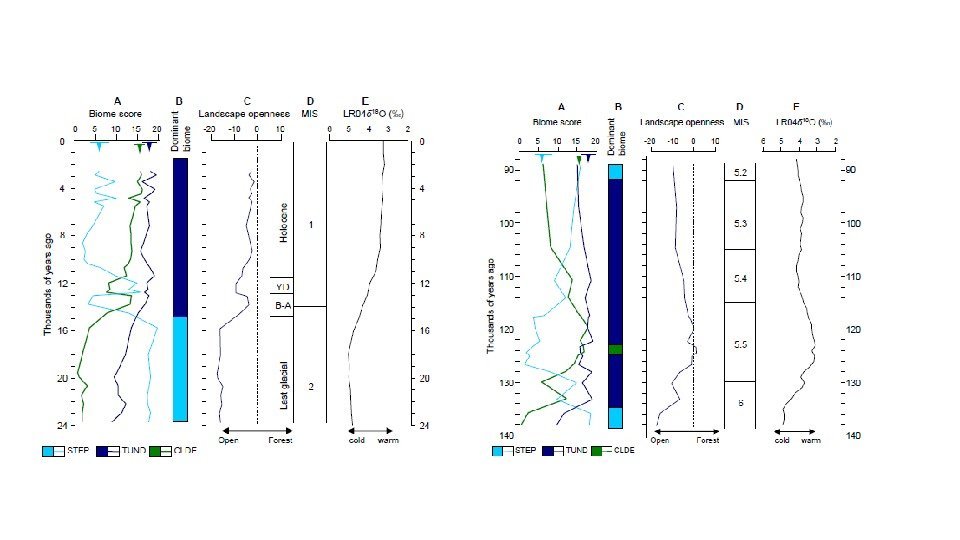
Summary of paleoenvironmental trends between 3580 and 2200 ka ago showing the (A) time series of the dominant vegetation types (biomes); (B) characteristic of landscape openness calculated as the difference between the maximum score of the forest biomes (MSFB) and the maximum score of the open biomes (MSOB) at each level; (C) pollen-based reconstructions of the mean temperature of the warmest month; (D) pollen-based reconstructions of mean annual precipitation (after Melles et al. , 2012; Brigham-Grette et al. , 2013); and (E) Pliocene–Pleistocene stack of 57 globally distributed benthic 18 O records with marine isotope stage (MIS) numbers (after Lisiecki and Raymo, 2005). Grey and white bands indicate cold and warm marine isotope stages, respectively. Biome names are abbreviated as follows: STEP – cold steppe, TUND – tundra, CLDE – cold deciduous forest, TAIG – taiga, COCO – cool conifer forest, and COMX – cool mixed forest.