
5 FIRM BEHAVIOR AND THE ORGANIZATION OF


- Размер: 3.2 Mегабайта
- Количество слайдов: 55
Описание презентации 5 FIRM BEHAVIOR AND THE ORGANIZATION OF по слайдам
5 FIRM BEHAVIOR AND THE ORGANIZATION OF INDUSTRY
Copyright© 2004 South-Western 1313 The Costs of Production
Copyright © 2004 South-Western/The Market Forces of Supply and Demand • Supply and demand are the two words that economists use most often. • Supply and demand are the forces that make market economies work. • Modern microeconomics is about supply, demand, and market equilibrium.
Copyright © 2004 South-Western/WHAT ARE COSTS? • According to the Law of Supply : • Firms are willing to produce and sell a greater quantity of a good when the price of the good is high. • This results in a supply curve that slopes upward.
Copyright © 2004 South-Western/WHAT ARE COSTS? • The Firm ’ s Objective • The economic goal of the firm is to maximize profits.
Copyright © 2004 South-Western/Total Revenue, Total Cost, and Profit • Total Revenue • The amount a firm receives for the sale of its output. • Total Cost • The market value of the inputs a firm uses in production.
Copyright © 2004 South-Western/Total Revenue, Total Cost, and Profit • Profit is the firm ’ s total revenue minus its total cost. Profit = Total revenue — Total cost
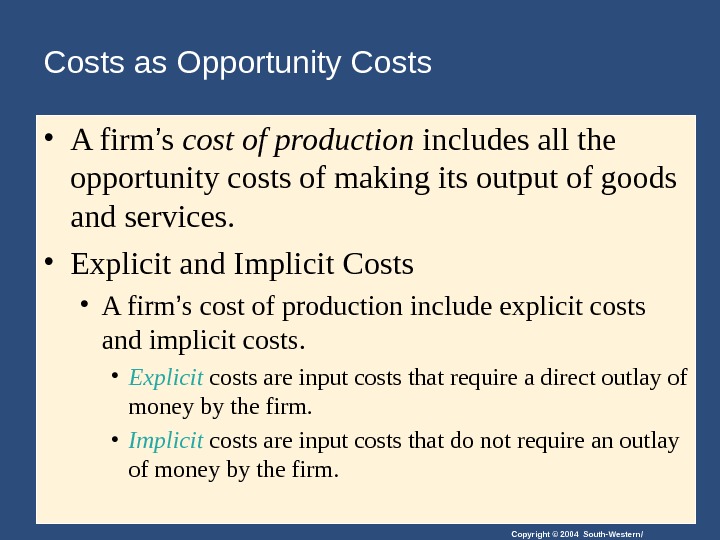
Copyright © 2004 South-Western/Costs as Opportunity Costs • A firm ’ s cost of production includes all the opportunity costs of making its output of goods and services. • Explicit and Implicit Costs • A firm ’ s cost of production include explicit costs and implicit costs. • Explicit costs are input costs that require a direct outlay of money by the firm. • Implicit costs are input costs that do not require an outlay of money by the firm.
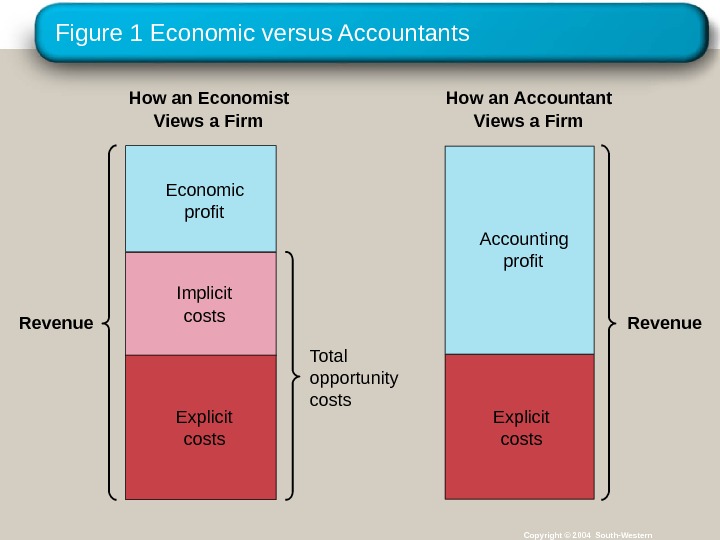
Copyright © 2004 South-Western/Economic Profit versus Accounting Profit • Economists measure a firm ’ s economic profit as total revenue minus total cost, including both explicit and implicit costs. • Accountants measure the accounting profit as the firm ’ s total revenue minus only the firm ’ s explicit costs.
Copyright © 2004 South-Western/Economic Profit versus Accounting Profit • When total revenue exceeds both explicit and implicit costs, the firm earns economic profit. • Economic profit is smaller than accounting profit.
Figure 1 Economic versus Accountants Copyright © 2004 South-Western. Revenue Total opportunity costs. How an Economist Views a Firm How an Accountant Views a Firm Revenue. Economic profit Implicit costs Explicit costs. Accounting profit
Table 1 A Production Function and Total Cost: Hungry Helen ’ s Cookie Factory Copyright© 2004 South-Western
Copyright © 2004 South-Western/PRODUCTION AND COSTS • The Production Function • The production function shows the relationship between quantity of inputs used to make a good and the quantity of output of that good.
Copyright © 2004 South-Western/The Production Function • Marginal Product • The marginal product of any input in the production process is the increase in output that arises from an additional unit of that input.
Copyright © 2004 South-Western/The Production Function • Diminishing Marginal Product • Diminishing marginal product is the property whereby the marginal product of an input declines as the quantity of the input increases. • Example: As more and more workers are hired at a firm, each additional worker contributes less and less to production because the firm has a limited amount of equipment.
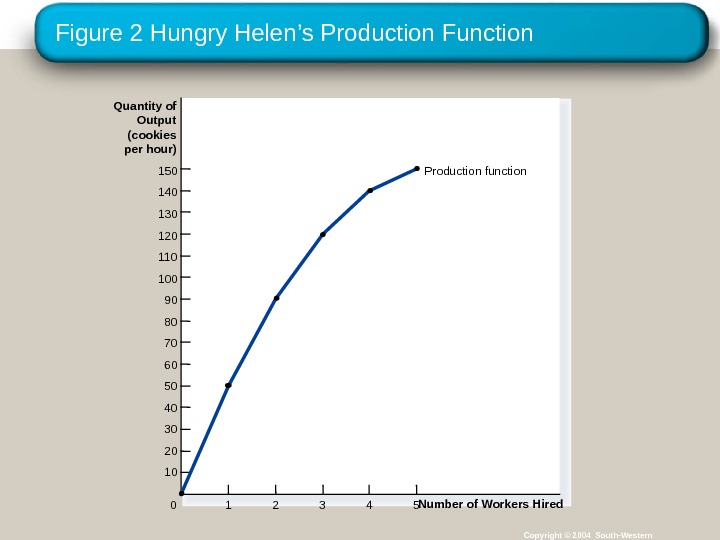
Figure 2 Hungry Helen ’s Production Function Copyright © 2004 South-Western. Quantity of Output (cookies per hour) 150 140 130 120 110 100 90 80 70 60 50 40 30 20 10 Number of Workers Hired 0 1 2 3 4 5 Production function
Copyright © 2004 South-Western/The Production Function • Diminishing Marginal Product • The slope of the production function measures the marginal product of an input, such as a worker. • When the marginal product declines, the production function becomes flatter.
Copyright © 2004 South-Western/From the Production Function to the Total-Cost Curve • The relationship between the quantity a firm can produce and its costs determines pricing decisions. • The total-cost curve shows this relationship graphically.
Table 1 A Production Function and Total Cost: Hungry Helen ’ s Cookie Factory Copyright© 2004 South-Western
Figure 3 Hungry Helen ’s Total-Cost Curve Copyright © 2004 South-Western. Total Cost $80 70 60 50 40 30 20 10 Quantity of Output (cookies per hour)0 10 20 30 15013011090705040 1401201008060 Total-cost curve
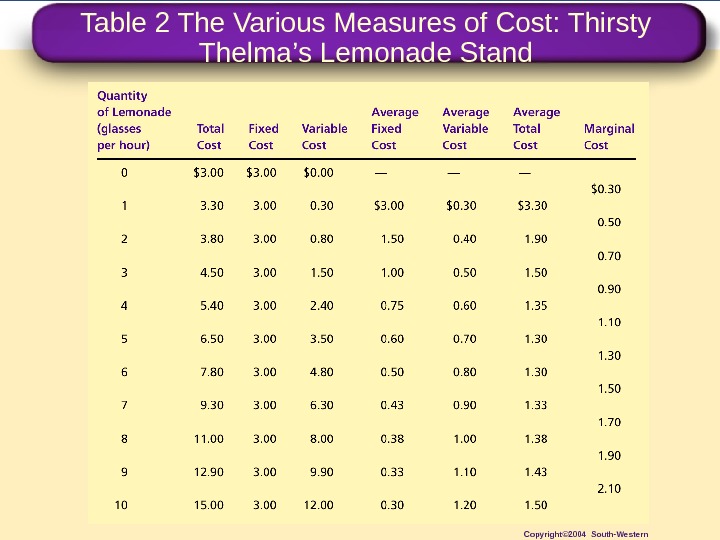
Copyright © 2004 South-Western/THE VARIOUS MEASURES OF COST • Costs of production may be divided into fixed costs and variable costs.
Copyright © 2004 South-Western/Fixed and Variable Costs • Fixed costs are those costs that do not vary with the quantity of output produced. • Variable costs are those costs that do vary with the quantity of output produced.
Copyright © 2004 South-Western/Fixed and Variable Costs • Total Fixed Costs ( TFC ) • Total Variable Costs ( TVC ) • Total Costs ( TC ) • TC = TFC + TV
Table 2 The Various Measures of Cost: Thirsty Thelma ’ s Lemonade Stand Copyright© 2004 South-Western
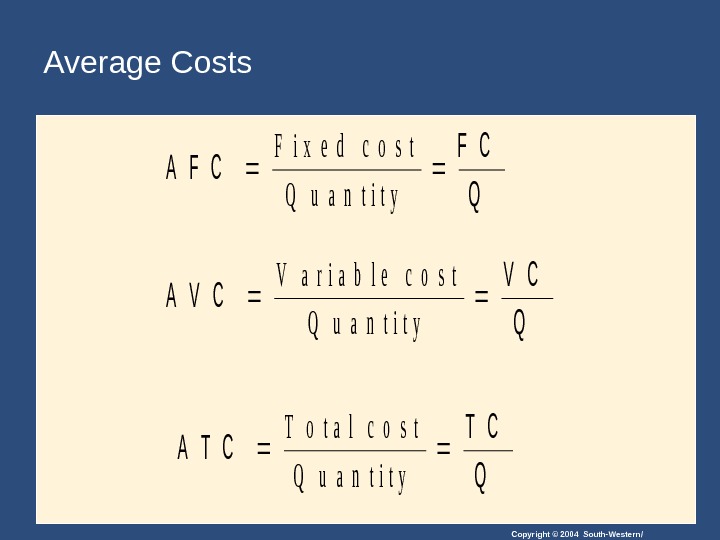
Copyright © 2004 South-Western/Fixed and Variable Costs • Average costs can be determined by dividing the firm ’ s costs by the quantity of output it produces. • The average cost is the cost of each typical unit of product.
Copyright © 2004 South-Western/Fixed and Variable Costs • Average Fixed Costs ( AFC ) • Average Variable Costs ( AVC ) • Average Total Costs ( ATC ) • ATC = AFC + AV
Copyright © 2004 South-Western/Average Costs. A F C Q F i x e d c o s t Q u a n t i t y A V C Q V a r i a b l e co s t Q u a n t i t y A T C Q T o t a l c o s t Q u a n t i t y
Table 2 The Various Measures of Cost: Thirsty Thelma ’ s Lemonade Stand Copyright© 2004 South-Western
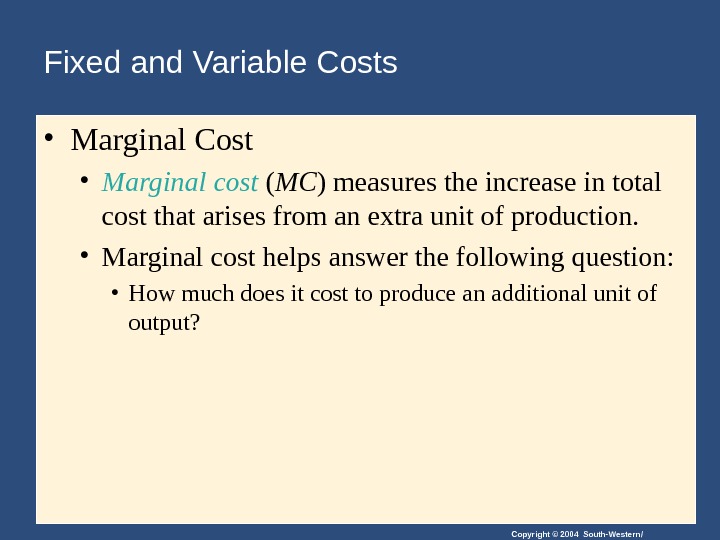
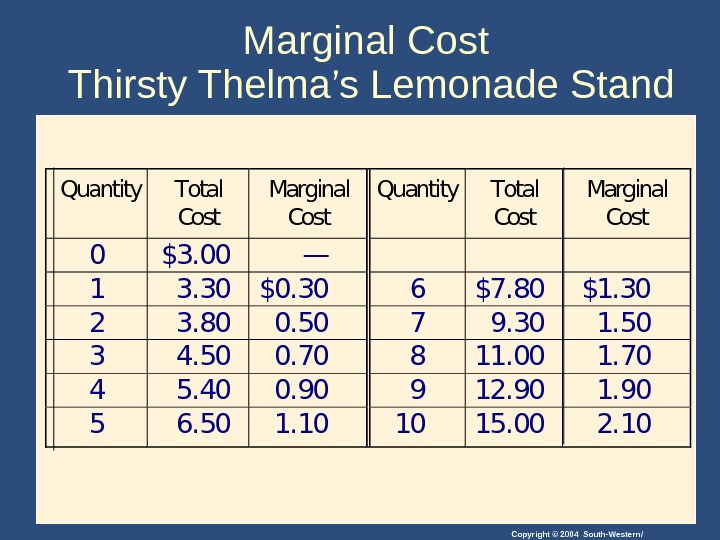
Copyright © 2004 South-Western/Fixed and Variable Costs • Marginal Cost • Marginal cost ( MC ) measures the increase in total cost that arises from an extra unit of production. • Marginal cost helps answer the following question: • How much does it cost to produce an additional unit of output?
Copyright © 2004 South-Western/Marginal Cost. M C T C Q (c h a n g e i n t o t a l c o s t) ( c h a n g e i n q u a n t i t y )
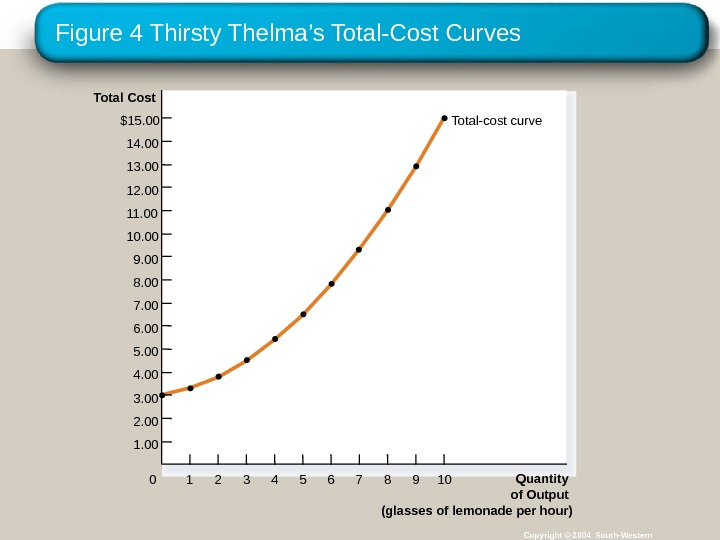
Copyright © 2004 South-Western/Marginal Cost Thirsty Thelma ’s Lemonade Stand. Quantity. Total Cost Marginal Cost 0$3. 00— 13. 30$0. 306$7. 80$1. 30 23. 800. 5079. 301. 50 34. 500. 70811. 001. 70 45. 400. 90912. 901. 90 56. 501. 101015. 002.
Figure 4 Thirsty Thelma ’s Total-Cost Curves Copyright © 2004 South-Western. Total Cost $15. 00 14. 00 13. 00 12. 00 11. 00 10. 00 9. 00 8. 00 7. 00 6. 00 5. 00 4. 00 3. 00 2. 00 1. 00 Quantity of Output (glasses of lemonade per hour)0 1 432 765 98 10 Total-cost curve
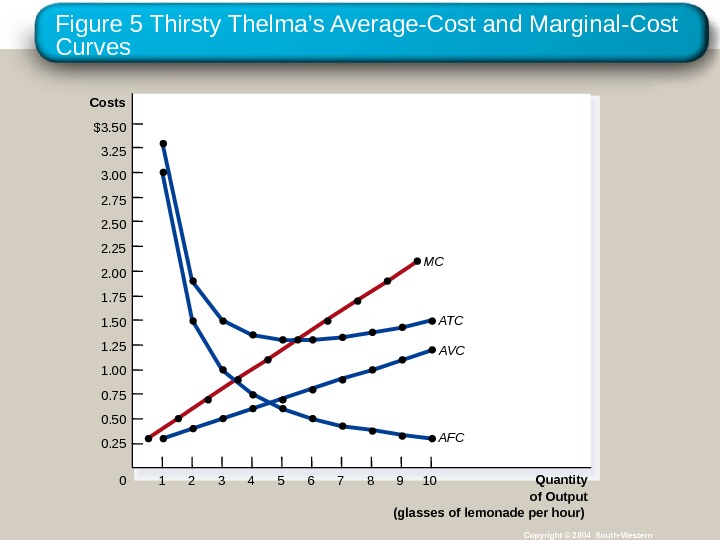
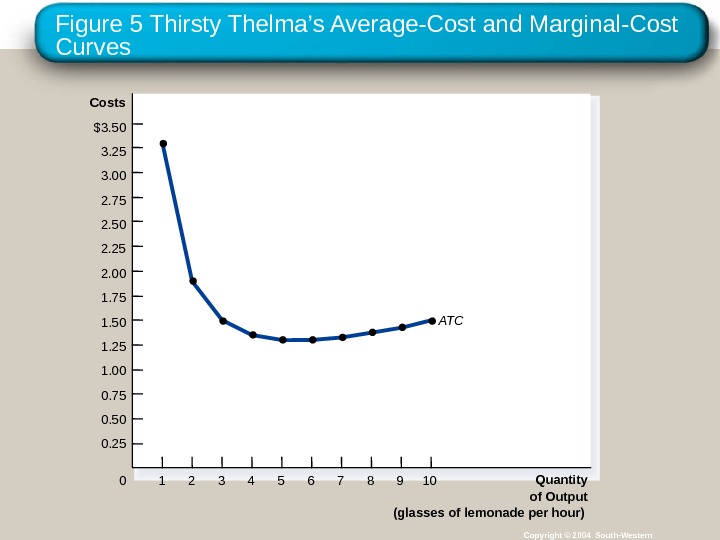
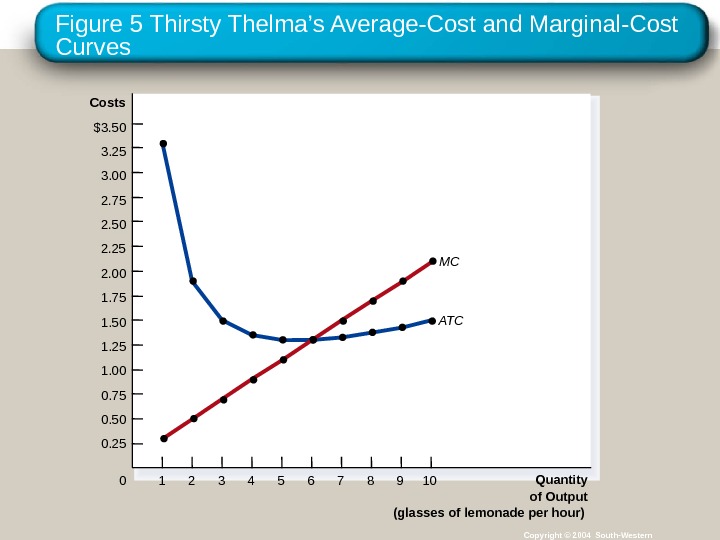
Figure 5 Thirsty Thelma ’s Average-Cost and Marginal-Cost Curves Copyright © 2004 South-Western. Costs $3. 50 3. 25 3. 00 2. 75 2. 50 2. 25 2. 00 1. 75 1. 50 1. 25 1. 00 0. 75 0. 50 0. 25 Quantity of Output (glasses of lemonade per hour)0 1 432 765 98 10 MC ATC AV
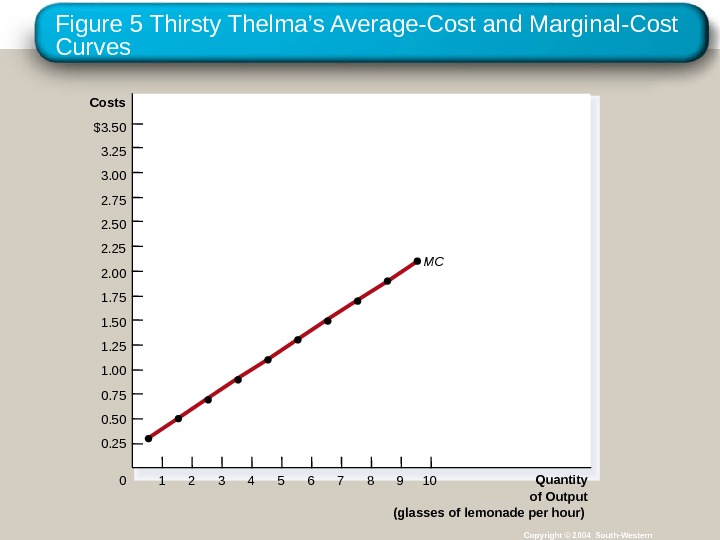
Copyright © 2004 South-Western/Cost Curves and Their Shapes • Marginal cost rises with the amount of output produced. • This reflects the property of diminishing marginal product.
Figure 5 Thirsty Thelma ’s Average-Cost and Marginal-Cost Curves Copyright © 2004 South-Western. Costs $3. 50 3. 25 3. 00 2. 75 2. 50 2. 25 2. 00 1. 75 1. 50 1. 25 1. 00 0. 75 0. 50 0. 25 Quantity of Output (glasses of lemonade per hour)0 1 432 765 98 10 M
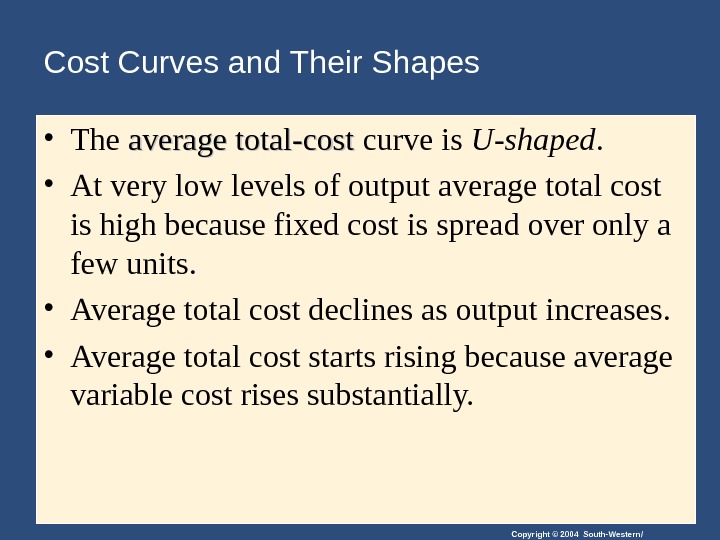
Copyright © 2004 South-Western/Cost Curves and Their Shapes • The average total-cost curve is U-shaped. • At very low levels of output average total cost is high because fixed cost is spread over only a few units. • Average total cost declines as output increases. • Average total cost starts rising because average variable cost rises substantially.
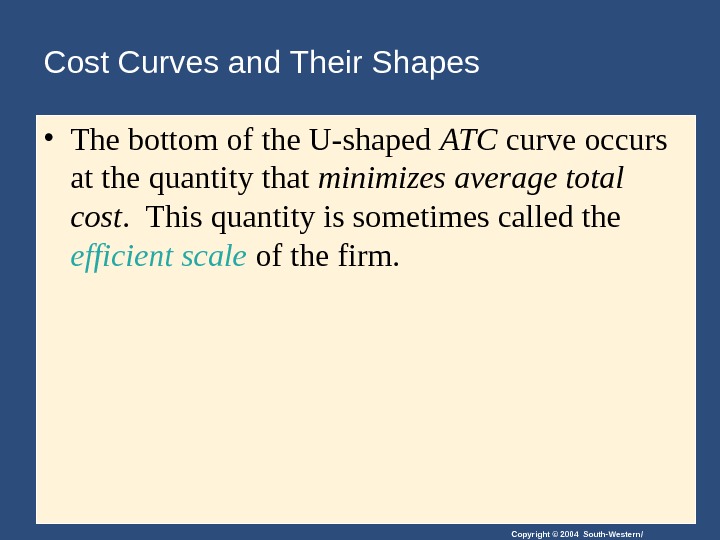
Copyright © 2004 South-Western/Cost Curves and Their Shapes • The bottom of the U-shaped ATC curve occurs at the quantity that minimizes average total cost. This quantity is sometimes called the efficient scale of the firm.
Figure 5 Thirsty Thelma ’s Average-Cost and Marginal-Cost Curves Copyright © 2004 South-Western. Costs $3. 50 3. 25 3. 00 2. 75 2. 50 2. 25 2. 00 1. 75 1. 50 1. 25 1. 00 0. 75 0. 50 0. 25 Quantity of Output (glasses of lemonade per hour)0 1 432 765 98 10 AT
Copyright © 2004 South-Western/Cost Curves and Their Shapes • Relationship between Marginal Cost and Average Total Cost • Whenever marginal cost is less than average total cost, average total cost is falling. • Whenever marginal cost is greater than average total cost, average total cost is rising.
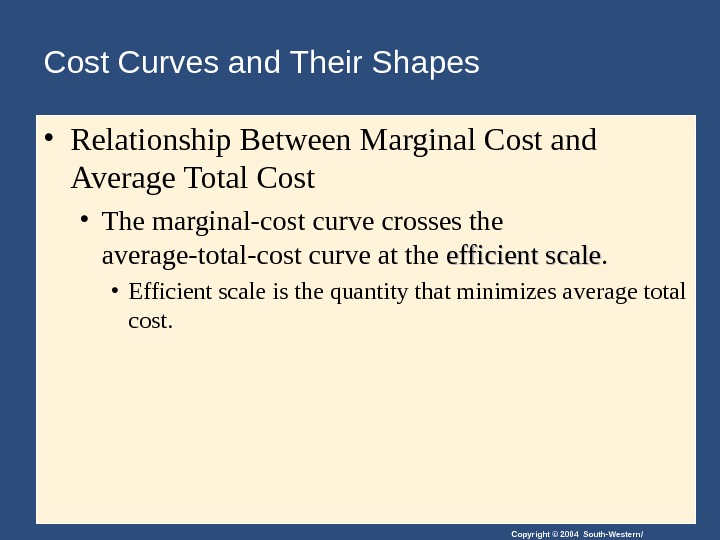
Copyright © 2004 South-Western/Cost Curves and Their Shapes • Relationship Between Marginal Cost and Average Total Cost • The marginal-cost curve crosses the average-total-cost curve at the efficient scale. • Efficient scale is the quantity that minimizes average total cost.
Figure 5 Thirsty Thelma ’s Average-Cost and Marginal-Cost Curves Copyright © 2004 South-Western. Costs $3. 50 3. 25 3. 00 2. 75 2. 50 2. 25 2. 00 1. 75 1. 50 1. 25 1. 00 0. 75 0. 50 0. 25 Quantity of Output (glasses of lemonade per hour)0 1 432 765 98 10 ATC M
Copyright © 2004 South-Western/Typical Cost Curves It is now time to examine the relationships that exist between the different measures of cost.
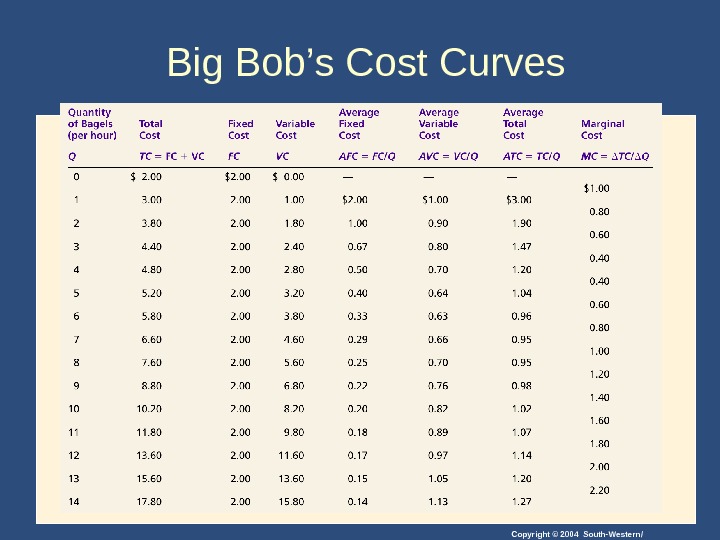
Copyright © 2004 South-Western/Big Bob ’ s Cost Curves
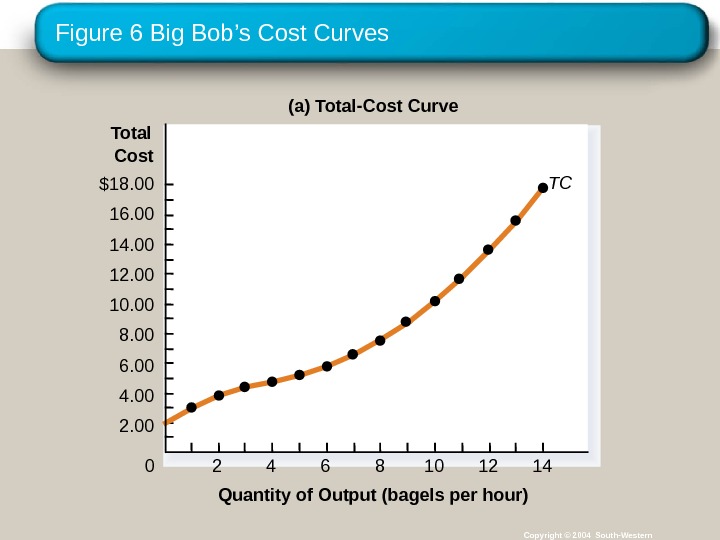
Figure 6 Big Bob ’s Cost Curves Copyright © 2004 South-Western(a) Total-Cost Curve $18. 00 16. 00 14. 00 12. 00 10. 00 8. 00 6. 00 4. 00 Quantity of Output (bagels per hour) TC 42 6 8 1412102. 00 Total Cost
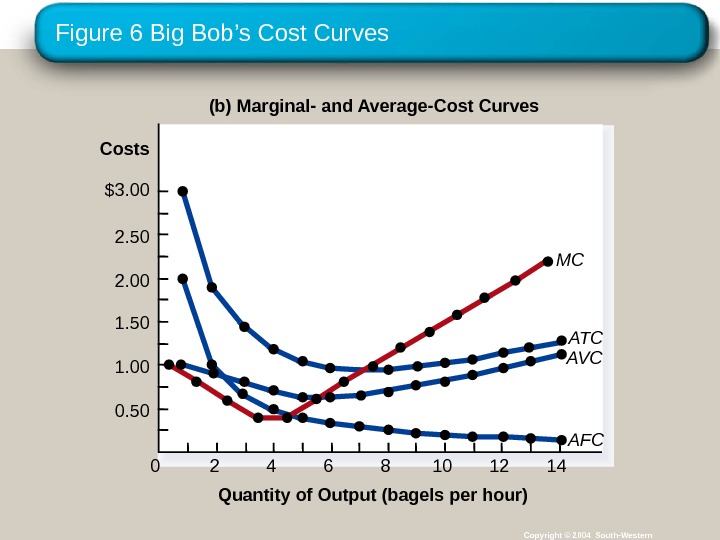
Figure 6 Big Bob ’s Cost Curves Copyright © 2004 South-Western(b) Marginal- and Average-Cost Curves Quantity of Output (bagels per hour)Costs $3. 00 2. 50 2. 00 1. 50 1. 00 0. 50 0 42 6 8 141210 MC ATC AV
Copyright © 2004 South-Western/Typical Cost Curves • Three Important Properties of Cost Curves • Marginal cost eventually rises with the quantity of output. • The average-total-cost curve is U-shaped. • The marginal-cost curve crosses the average-total-cost curve at the minimum of average total cost.
Copyright © 2004 South-Western/COSTS IN THE SHORT RUN AND IN THE LONG RUN • For many firms, the division of total costs between fixed and variable costs depends on the time horizon being considered. • In the short run, some costs are fixed. • In the long run, fixed costs become variable costs.
Copyright © 2004 South-Western/COSTS IN THE SHORT RUN AND IN THE LONG RUN • Because many costs are fixed in the short run but variable in the long run, a firm ’ s long-run cost curves differ from its short-run cost curves.
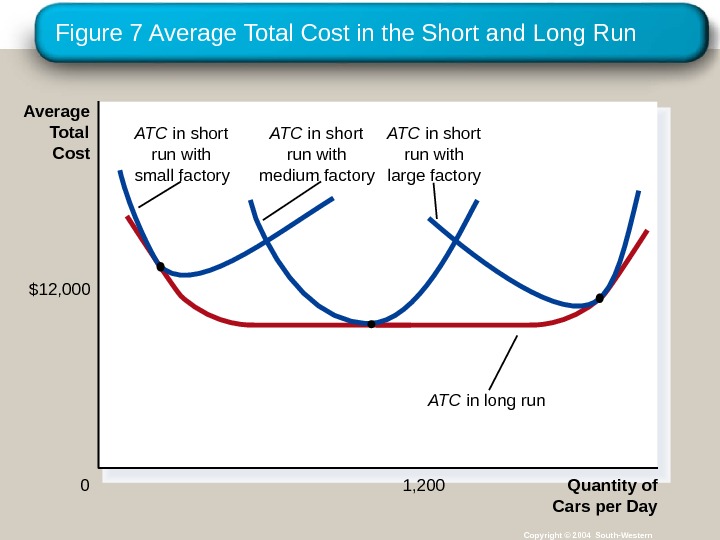
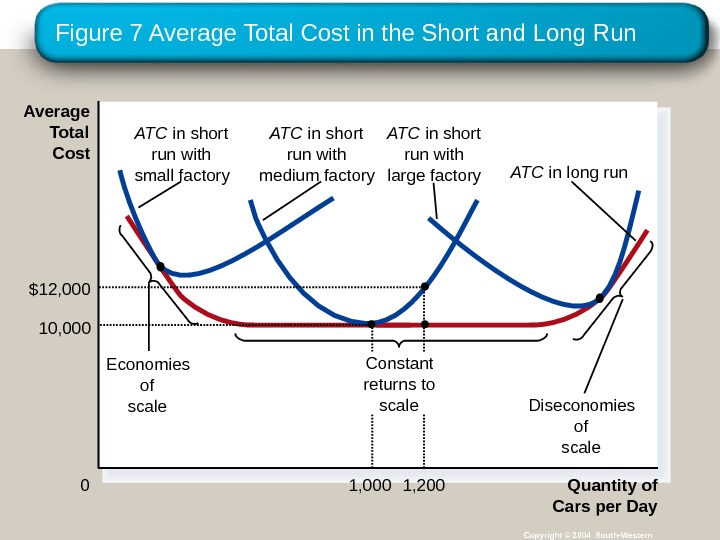
Figure 7 Average Total Cost in the Short and Long Run Copyright © 2004 South-Western Quantity of Cars per Day 0 Average Total Cost 1, 200$12, 000 ATC in short run with small factory ATC in short run with medium factory ATC in short run with large factory ATC in long run
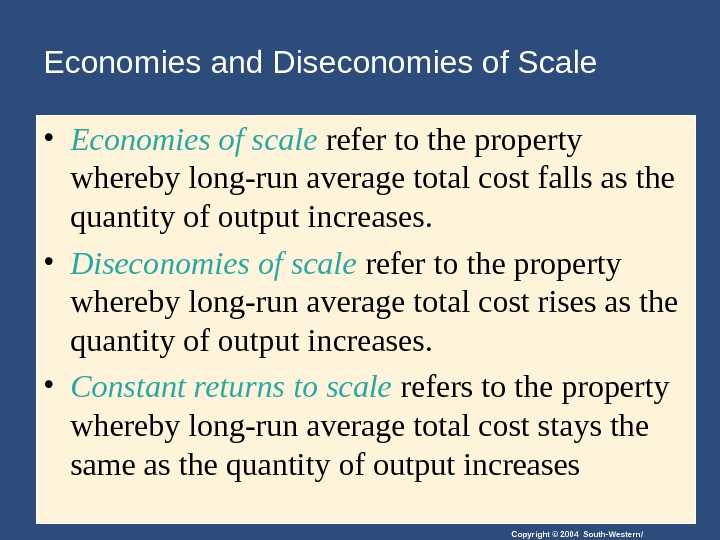
Copyright © 2004 South-Western/Economies and Diseconomies of Scale • Economies of scale refer to the property whereby long-run average total cost falls as the quantity of output increases. • Diseconomies of scale refer to the property whereby long-run average total cost rises as the quantity of output increases. • Constant returns to scale refers to the property whereby long-run average total cost stays the same as the quantity of output increases
Figure 7 Average Total Cost in the Short and Long Run Copyright © 2004 South-Western Quantity of Cars per Day 0 Average Total Cost 1, 200$12, 000 1, 00010, 000 Economies of scale ATC in short run with small factory ATC in short run with medium factory ATC in short run with large factory ATC in long run Diseconomies of scale. Constant returns to scale
Copyright © 2004 South-Western/Summary • The goal of firms is to maximize profit, which equals total revenue minus total cost. • When analyzing a firm ’ s behavior, it is important to include all the opportunity costs of production. • Some opportunity costs are explicit while other opportunity costs are implicit.
Copyright © 2004 South-Western/Summary • A firm ’ s costs reflect its production process. • A typical firm ’ s production function gets flatter as the quantity of input increases, displaying the property of diminishing marginal product. • A firm ’ s total costs are divided between fixed and variable costs. Fixed costs do not change when the firm alters the quantity of output produced; variable costs do change as the firm alters quantity of output produced.
Copyright © 2004 South-Western/Summary • Average total cost is total cost divided by the quantity of output. • Marginal cost is the amount by which total cost would rise if output were increased by one unit. • The marginal cost always rises with the quantity of output. • Average cost first falls as output increases and then rises.
Copyright © 2004 South-Western/Summary • The average-total-cost curve is U-shaped. • The marginal-cost curve always crosses the average-total-cost curve at the minimum of ATC. • A firm ’ s costs often depend on the time horizon being considered. • In particular, many costs are fixed in the short run but variable in the long run.