
35 Extending the Analysis of Aggregate Supply Mc.

extending_the_analysis_of_aggregate_supply.ppt
- Размер: 972.5 Кб
- Количество слайдов: 17
Описание презентации 35 Extending the Analysis of Aggregate Supply Mc. по слайдам
35 Extending the Analysis of Aggregate Supply Mc. Graw-Hill/Irwin Copyright © 2012 by The Mc. Graw-Hill Companies, Inc. All rights reserved.
From Short Run to Long Run • Short run • Input prices inflexible • Upsloping aggregate supply • Long run • Input prices fully flexible • Vertical aggregate supply • The transition? LO 1 35 —
From Short Run to Long Run • Production above potential output: • High demand for inputs • Input prices rise • Short run aggregate supply shifts left • Return to potential output • Production below potential output • Graphical examples… LO 1 35 —
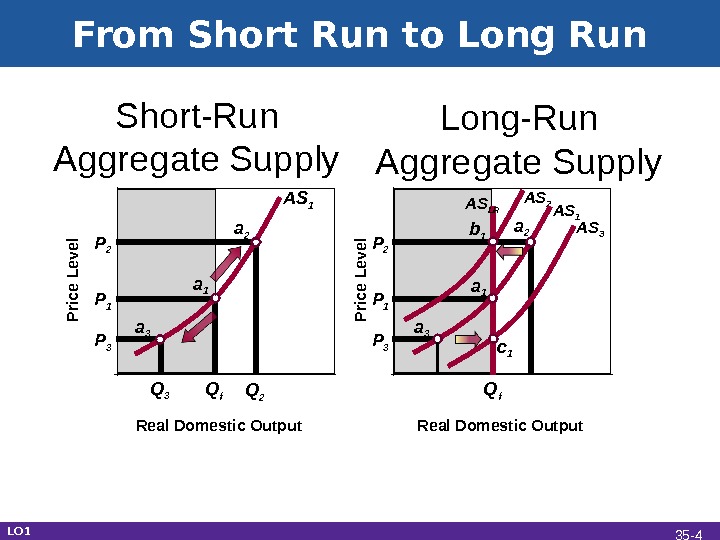
From Short Run to Long Run P 3 P 1 P 2 Real Domestic Output Q f. Short-Run Aggregate Supply Long-Run Aggregate Supply a 1 a 2 a 3 b 1 c 1 P rice Level AS 3 AS 2 AS 1 AS LR Q f Q 2 Q 3 AS 1 a 2 a 3 LO 1 35 —
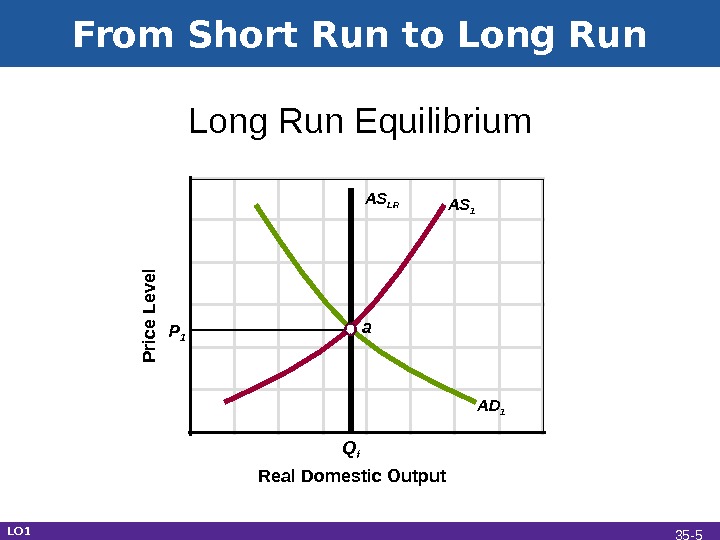
From Short Run to Long Run Real Domestic Output. Long Run Equilibrium. P rice L e ve l P 1 Q f a AS 1 AS LR AD 1 LO 1 35 —
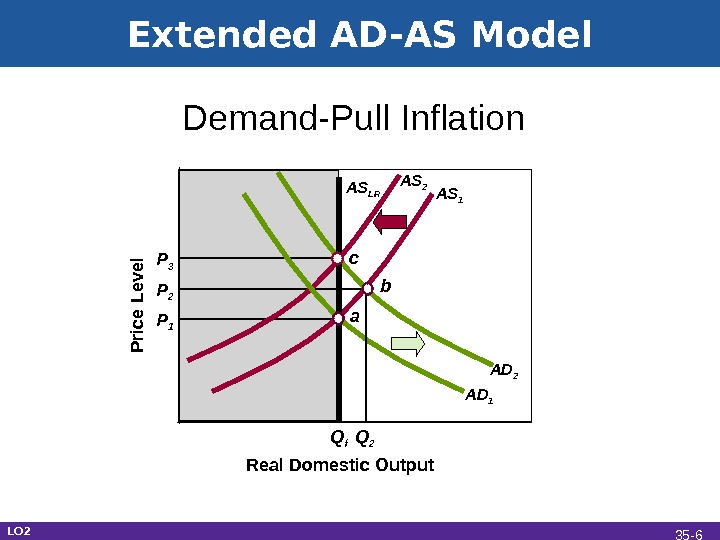
Extended AD-AS Model Real Domestic Output. Demand-Pull Inflation P rice L e vel P 1 Q f a AS 1 AS LR AD 1 AD 2 AS 2 c b P 2 P 3 Q 2 LO 2 35 —
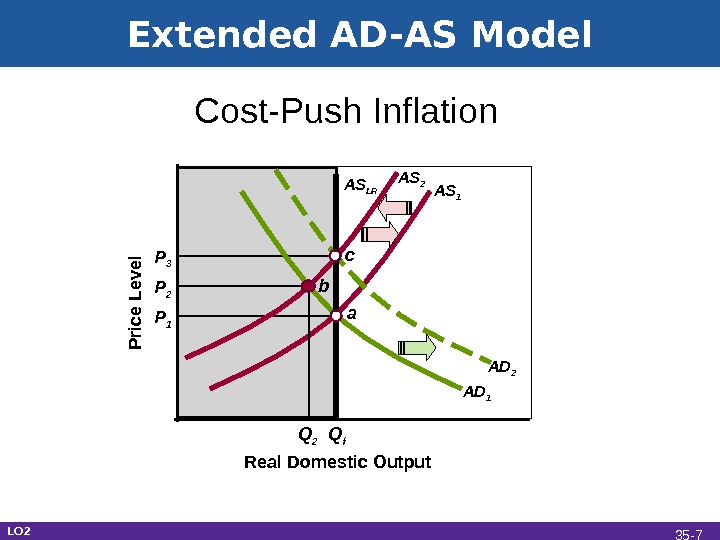
Extended AD-AS Model Real Domestic Output. Cost-Push Inflation P rice L e ve l P 1 Q f a AS 1 AS LR AD 1 AD 2 AS 2 b c P 2 P 3 Q 2 LO 2 35 —
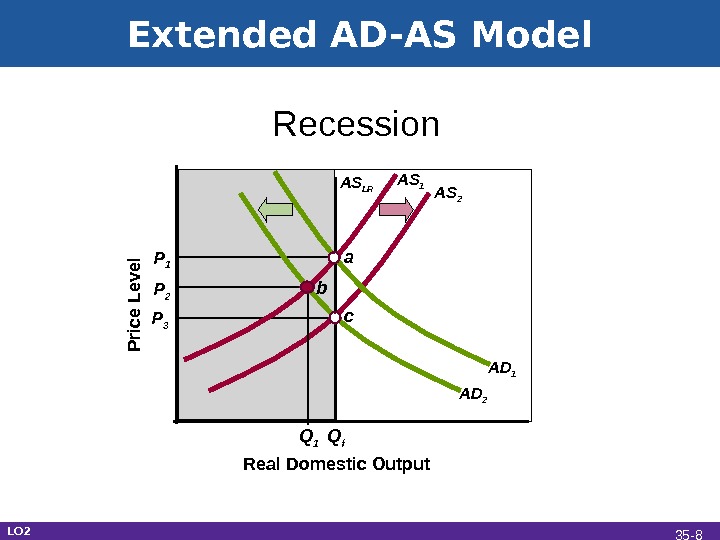
Extended AD-AS Model Real Domestic Output Recession. P rice L e vel P 1 Q f a AS 1 AS LR AD 1 AD 2 AS 2 b c. P 2 P 3 Q 1 LO 2 35 —
Extended AD-AS Model • Explaining ongoing inflation • Ongoing economic growth shifts aggregate supply • Ongoing increases in money supply shift aggregate demand • Small positive rate of inflation LO 2 35 —
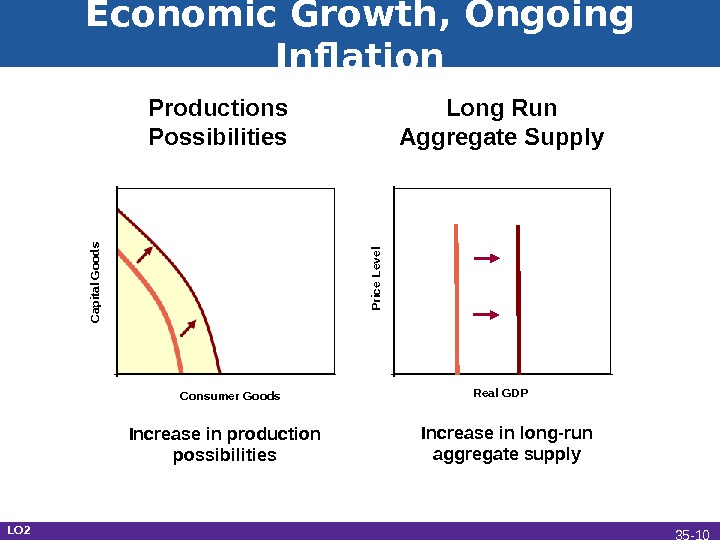
Price Level. Real GDP Capital Goods Consumer Goods. Economic Growth, Ongoing Inflation Productions Possibilities Long Run Aggregate Supply Increase in production possibilities Increase in long-run aggregate supply LO 2 35 —
Inflation and Unemployment • Low inflation and unemployment • Fed’s major goals • Compatible or conflicting? • Short-run tradeoff • Supply shocks cause both rates to rise • No long-run tradeoff LO 3 35 —
• 1960 s economists believed in stable, predictable tradeoff • Phillips curve shifts over time • Adverse supply shocks 1970 s • OPEC oil price shock • Stagflation’s demise 1980 s The Phillips Curve LO 3 35 —
Alban William Phillips
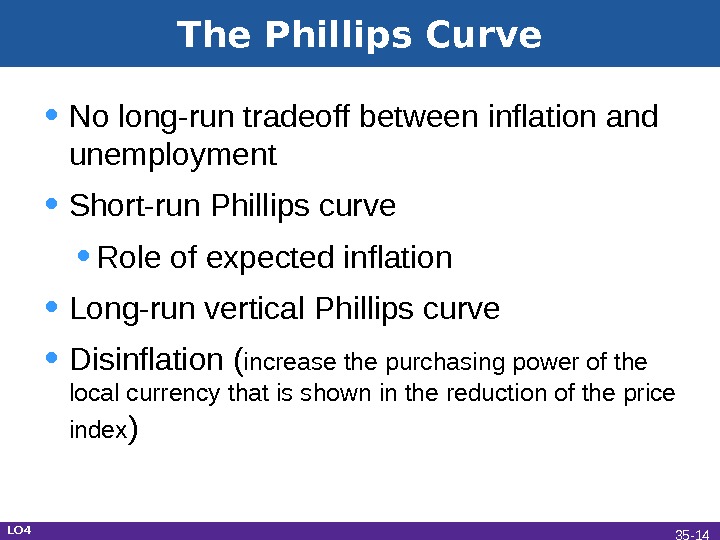
The Phillips Curve • No long-run tradeoff between inflation and unemployment • Short-run Phillips curve • Role of expected inflation • Long-run vertical Phillips curve • Disinflation ( increase the purchasing power of the local currency that is shown in the reduction of the price index ) LO 4 35 —
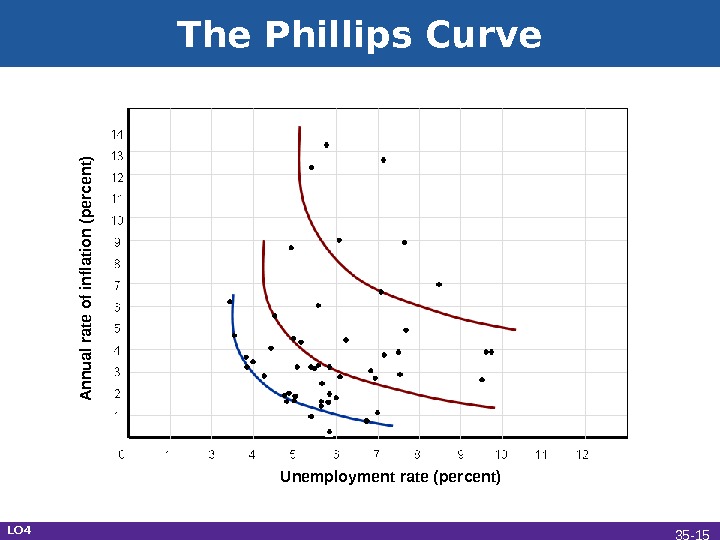
The Phillips Curve LO 4 14 13 12 11 10 9 8 7 6 5 4 3 2 1 A nnual rate of inflation (percent) Unemployment rate (percent) 35 —
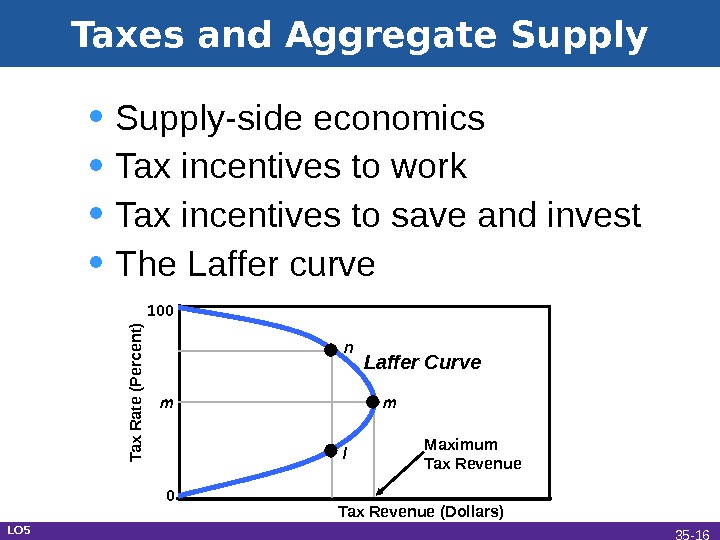
Taxes and Aggregate Supply • Supply-side economics • Tax incentives to work • Tax incentives to save and invest • The Laffer curve. Tax R ate (P ercent) Tax Revenue (Dollars)100 m 0 n l m. Laffer Curve Maximum Tax Revenue LO 5 35 —
Taxes and Aggregate Supply • Criticisms of the Laffer curve • Taxes, incentives, and time • Inflation and higher real interest rates • Position on the curve • Rebuttal and evaluation LO 5 35 —