
2 nd Year Perception Lab Keith Langley


- Размер: 2.6 Mегабайта
- Количество слайдов: 43
Описание презентации 2 nd Year Perception Lab Keith Langley по слайдам
2 nd Year Perception Lab Keith Langley Psychology, UCL, UK.
What is Psychophysics? The study of the relation: • between a physical stimulus causing the sensation and the sensation registered in the mind To study how we perceive things: • know about the properties of the physical world, the properties of our sensory system and higher-level processing that interprets sensory signals
How To Begin Experiments Question – Observation — Curiosity • How does the brain interpret X? • A small “circlular disc” in a photoshot appears further away than a large “circular disc”: Why? • What happens if?
Vision Experiments Direct control over input • Stimulus – Response- Measurement — Data Test explicit models or ideas • Predictions consistent with data? Documentation of trends • Contrast sensitivity versus age • Differences across individuals Report “surprise” or new phenomenon
Seeing and Believing Vision is often biased: • Fast adaptation — changes in bottom-up processes (After-effects) • A priori assumptions about the 3 -D world may be combined with bottom-up information
Tips on Vision Experiments Low Level Vision (motion, lightness, contrast) • Extensively studied • Many models & theories -> Good Understanding • Predictions easier to test High Level Vision (Reading, Face Perception) • Less well studied (but improving) • Fewer models -> Some understanding • Current direction of intense research in Psychology
Additional Tips Try to: • Keep viewing distances fixed • Always use the same monitor (try to keep external variables fixed) • Keep background conditions fixed (don’t run experiments in lab 1 and the cubicles) • Maintain a constant measurement criterion & instruct all subjects similarly! • Don’t play with monitor settings
Topics Form Perception • Grouping/ visual search • Parallel versus serial processing Depth Perception: Shading • Moncular cues & a priori assumptions Visual illusions • Geometric illusions • Perceived distortions of visual space
Topics Adaptation and after-effects • Motion after-effect • Tilt-illusion • Underlying mechanisms Face Perception • Hollow face • Specialised mechanisms for faces?
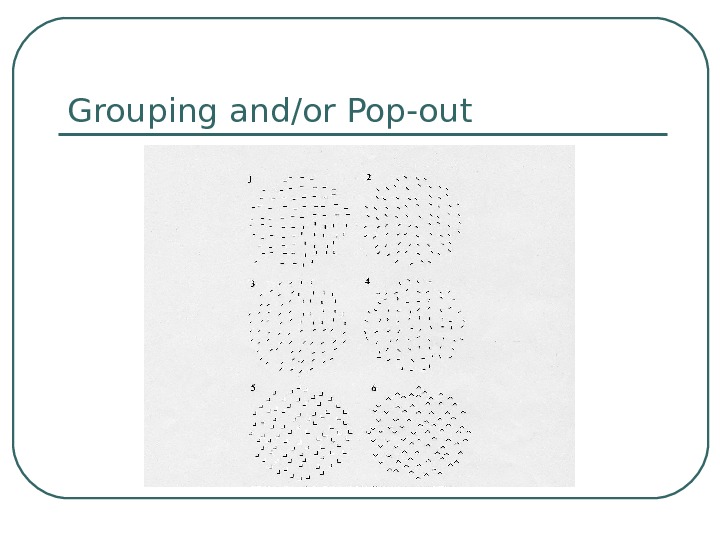
Grouping and/or Pop-out
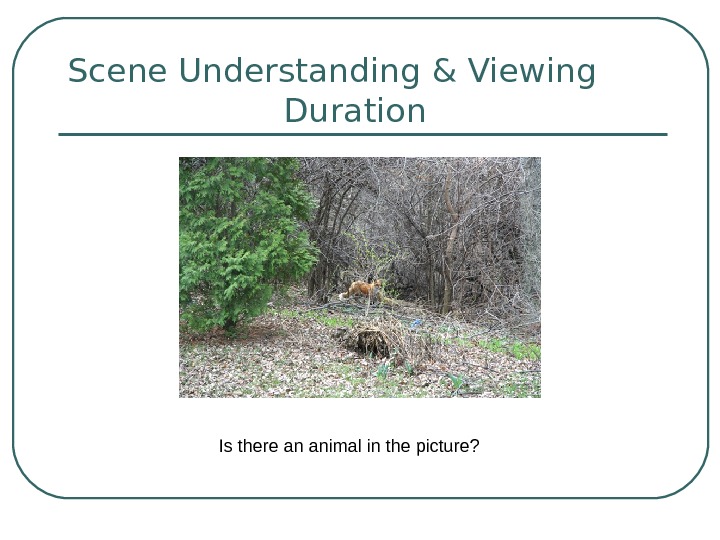
Scene Understanding & Viewing Duration Is there an animal in the picture?
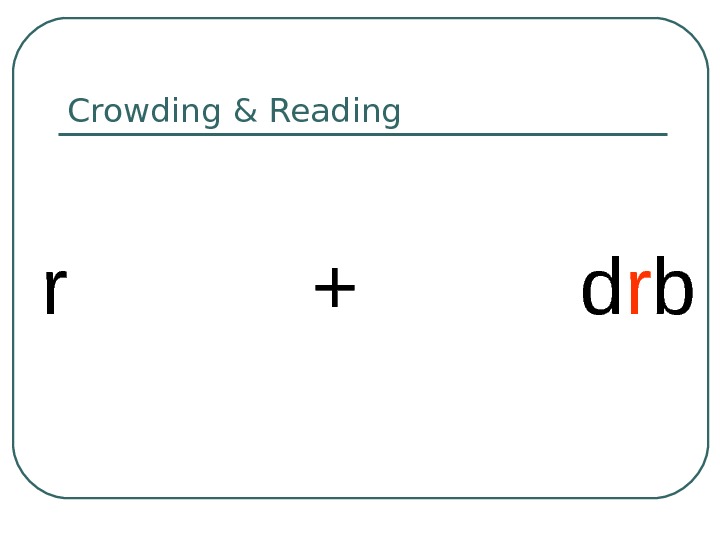
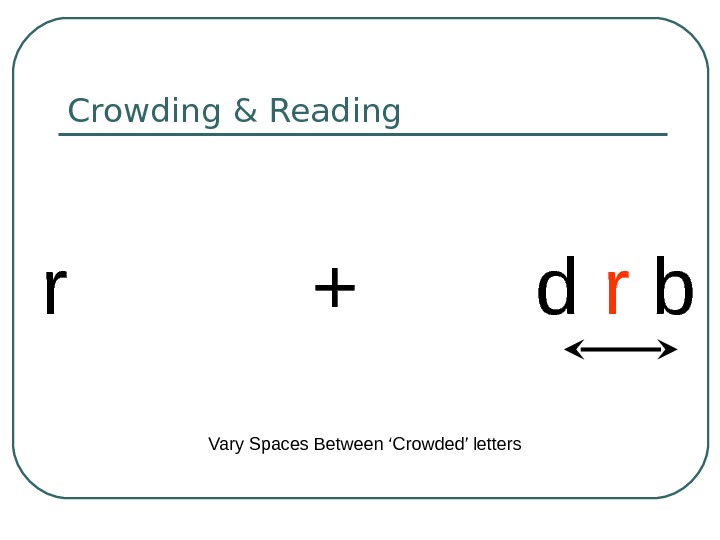
Crowding & Reading r + d r b
Crowding & Reading r + d r b Vary Spaces Between ‘Crowded’ letters
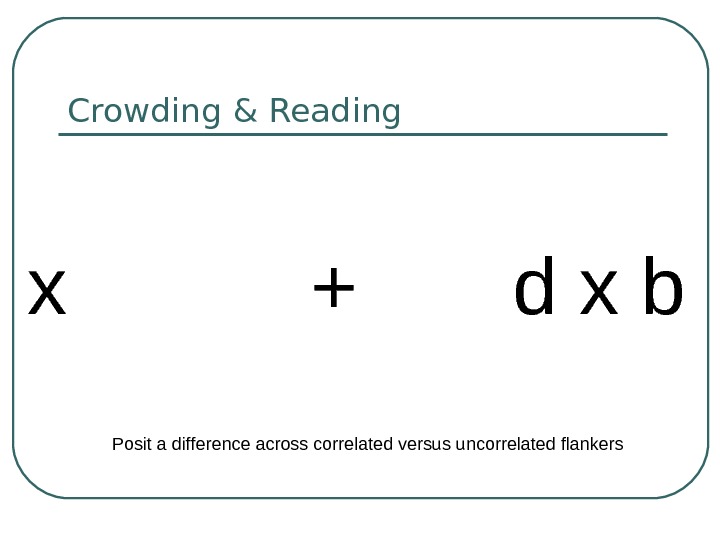
Crowding & Reading x + d x b Posit a difference across correlated versus uncorrelated flankers
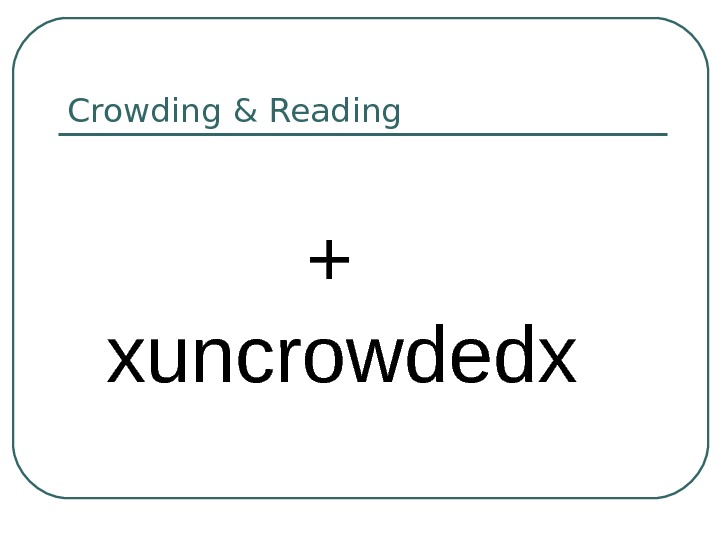
Crowding & Reading + xuncrowdedx
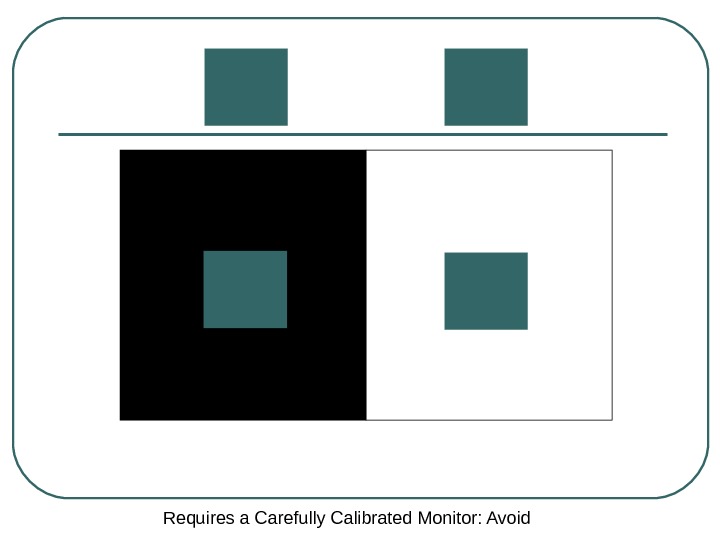
Simultaneous Contrast
Requires a Carefully Calibrated Monitor: Avoid
Shape & Depth Perception “ Monocular images” are insufficient to interpret the 3 -D world • A priori information • e. g. Light sources “shine from above”
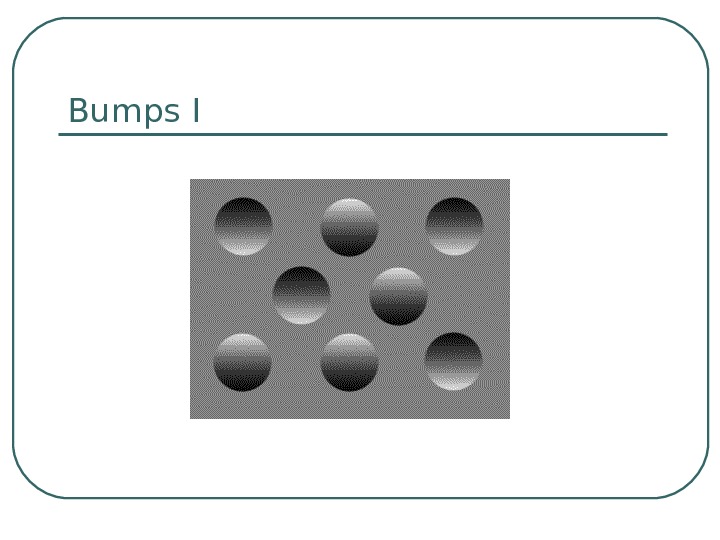
Bumps I
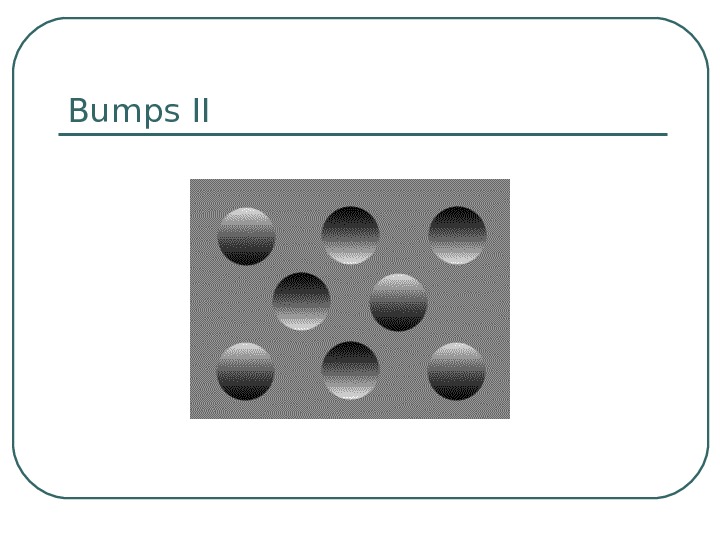
Bumps II
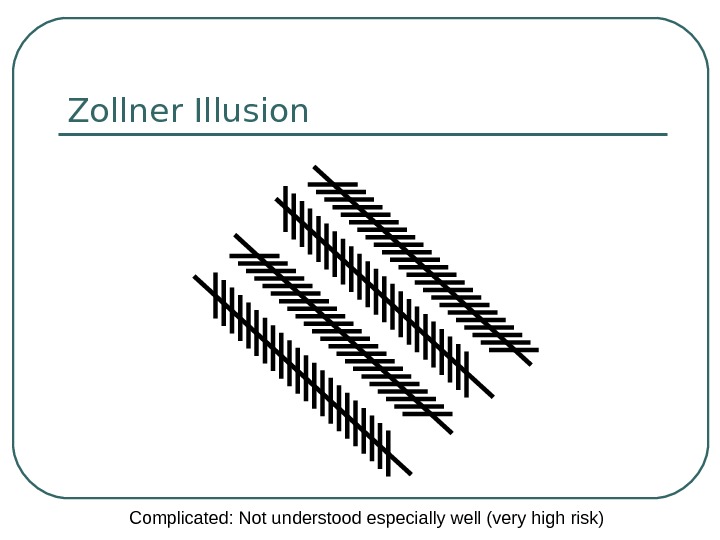
Zollner Illusion Complicated: Not understood especially well (very high risk)
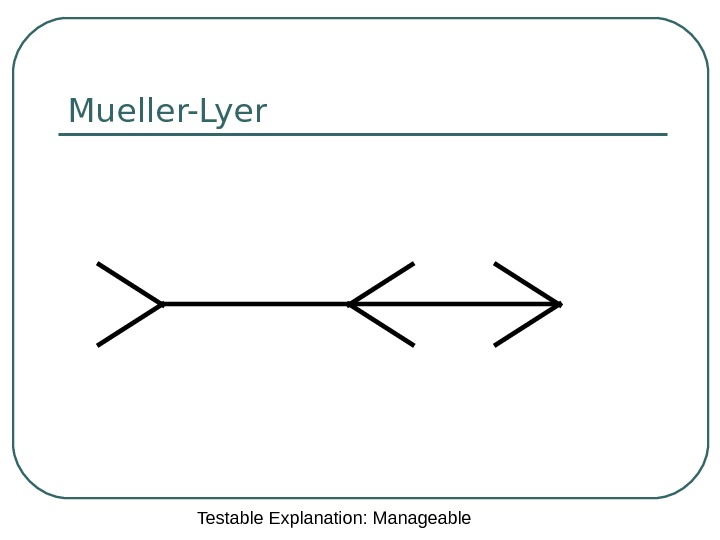
Mueller-Lyer Testable Explanation: Manageable
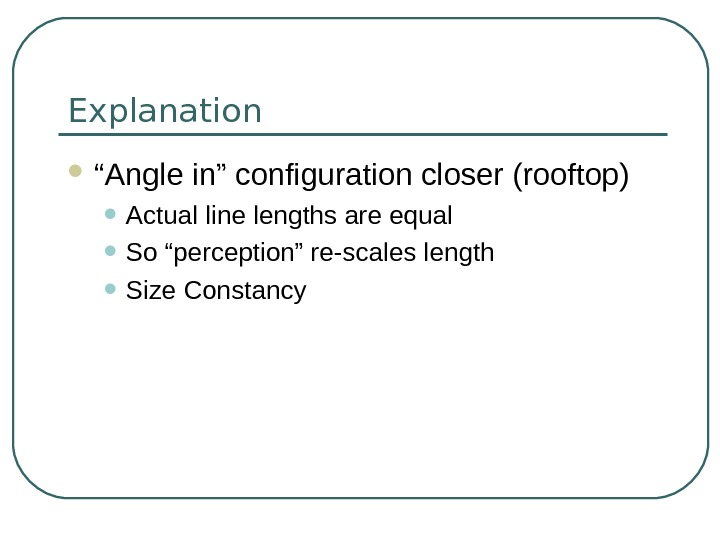
Explanation “ Angle in” configuration closer (rooftop) • Actual line lengths are equal • So “perception” re-scales length • Size Constancy
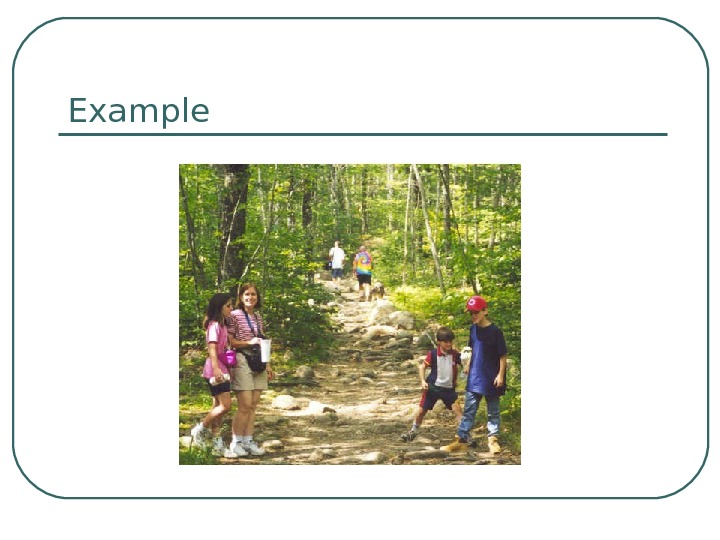
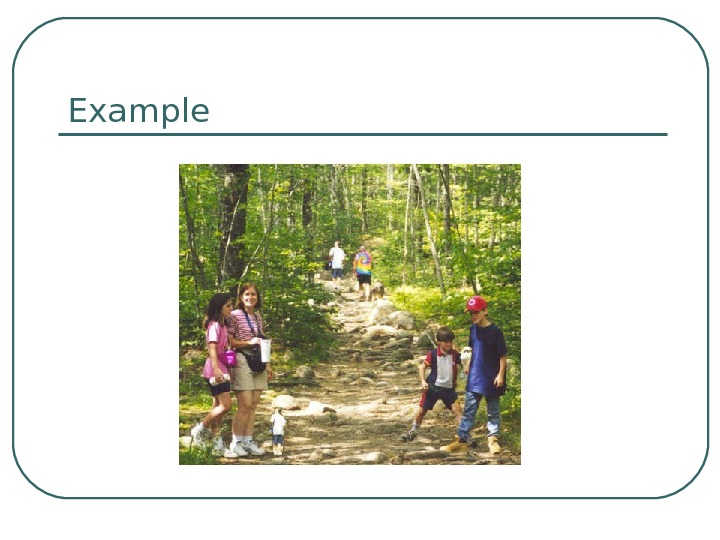
Example
Example
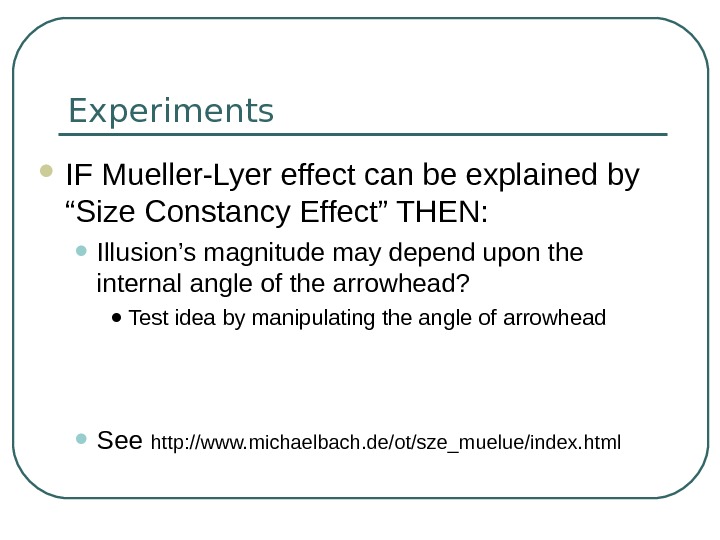
Experiments IF Mueller-Lyer effect can be explained by “Size Constancy Effect” THEN: • Illusion’s magnitude may depend upon the internal angle of the arrowhead? • Test idea by manipulating the angle of arrowhead • See http: //www. michaelbach. de/ot/sze_muelue/index. html
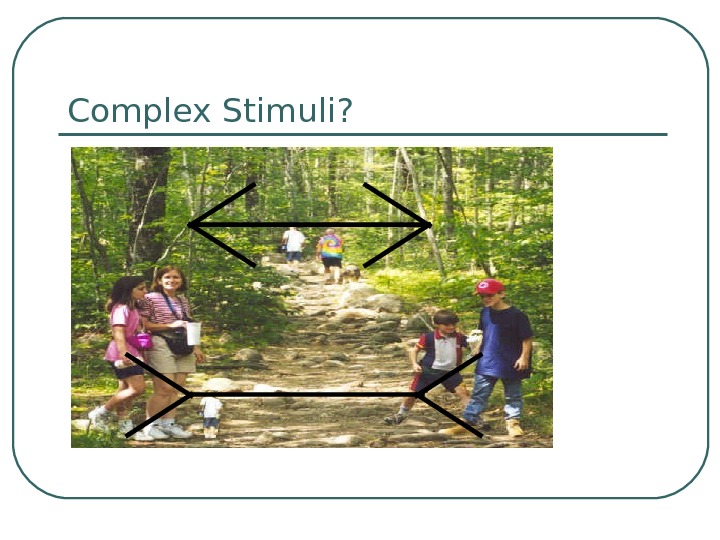
Complex Stimuli?
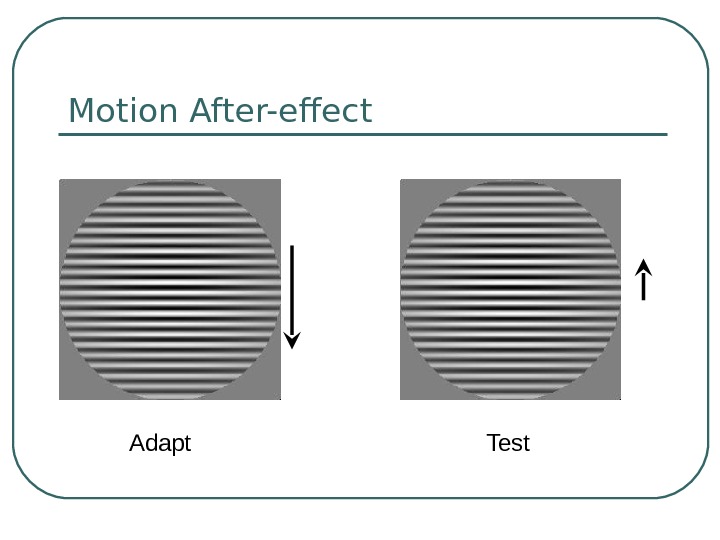
Motion After-effect Adapt Test
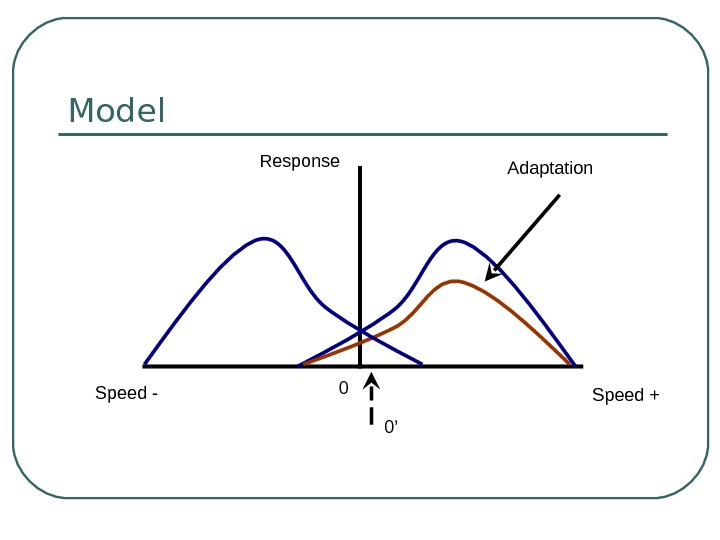
Model Response Speed +Speed — 0 Adaptation 0’
Possible Manipulations Duration of the adaptation period Speed of the adapting pattern Test across large number of subjects Differences in spatial oscillations (frequency) between adapt and test • Could also “flicker the test pattern” – dynamic motion after-effect
Face/Shape Perception – Fault Tolerance Stereopsis versus shape & shading • Hollow face • Specialized face processing areas • Bias that “faces” are convex surfaces • Near: Stereo dominates: Face appears hollow • Far: Monocular cues dominate: Face appears “normal” • Create your own 3 -D shapes using Papier Mashe
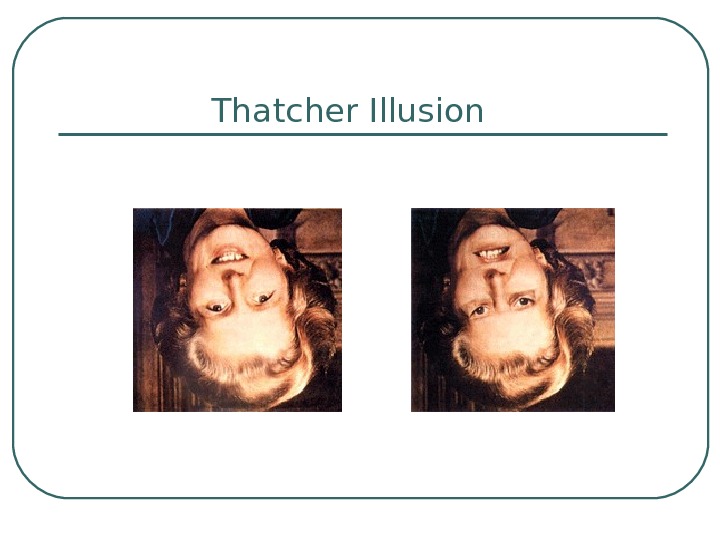
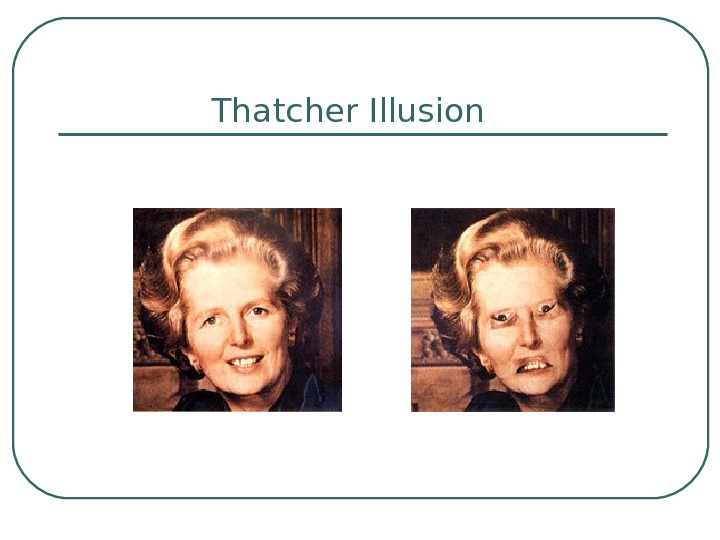
Thatcher Illusion
Thatcher Illusion
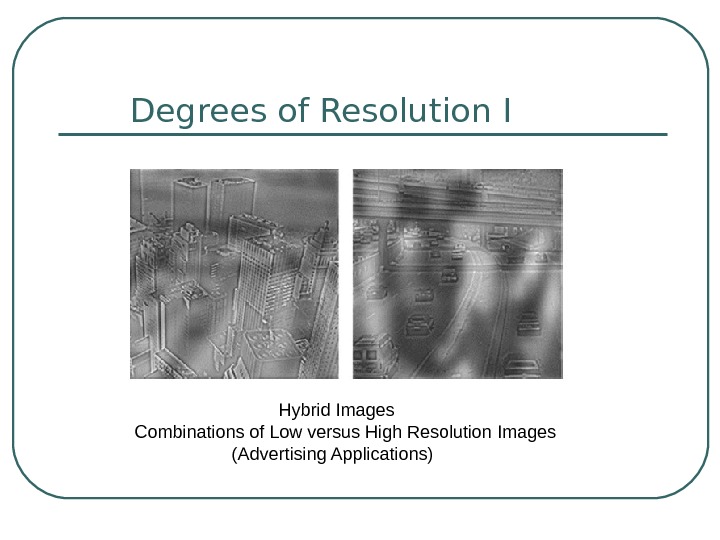
Degrees of Resolution I Hybrid Images Combinations of Low versus High Resolution Images (Advertising Applications)
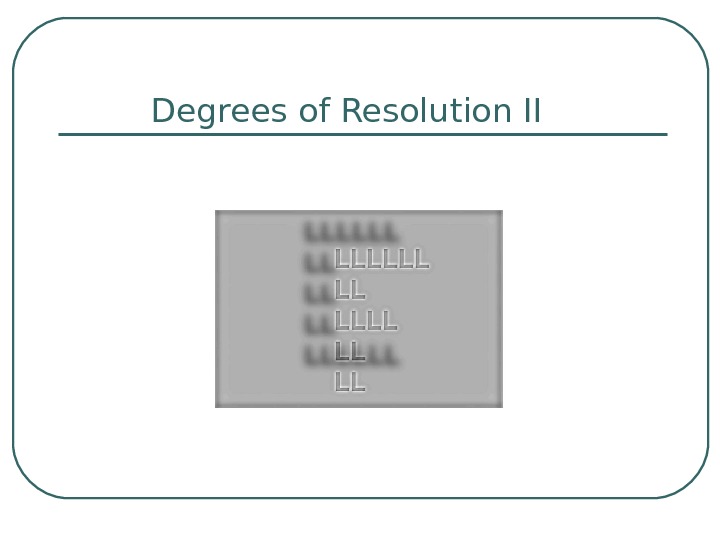
Degrees of Resolution II
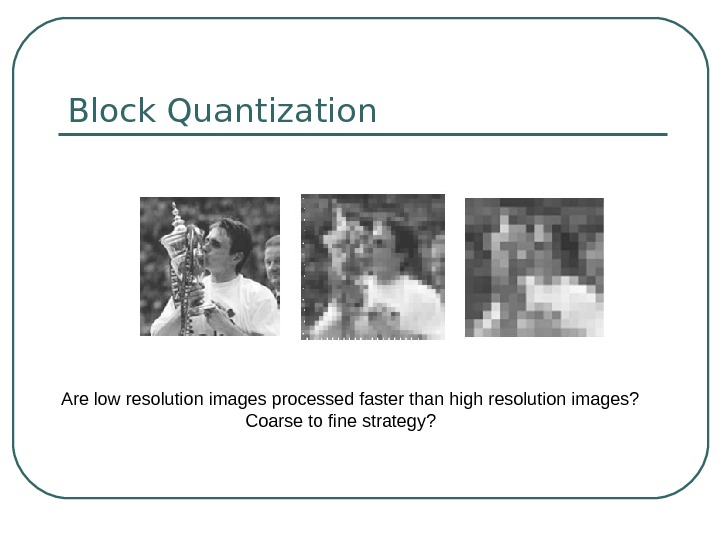
Block Quantization Are low resolution images processed faster than high resolution images? Coarse to fine strategy?
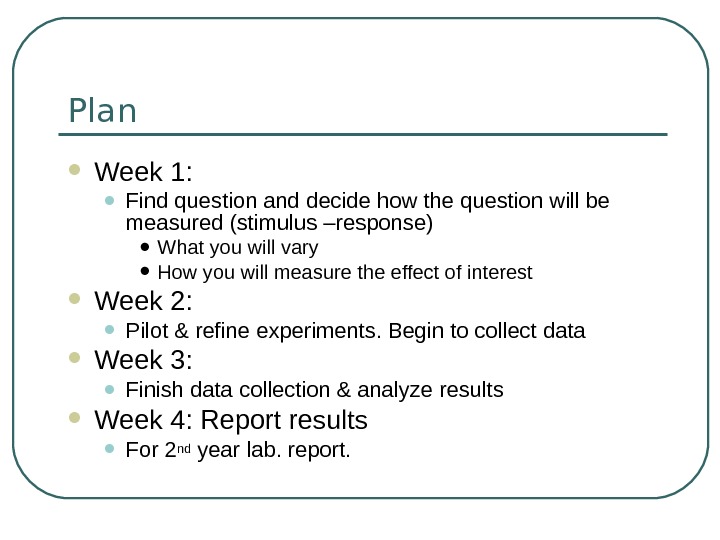
Plan Week 1: • Find question and decide how the question will be measured (stimulus –response) • What you will vary • How you will measure the effect of interest Week 2: • Pilot & refine experiments. Begin to collect data Week 3: • Finish data collection & analyze results Week 4: Report results • For 2 nd year lab. report.
Stimuli Presentation Draw stimuli on card Powerpoint Computer Control (some software available)
Measurement Stop-watch Ruler Automatic recording: • Powerpoint (Slide timing, figure length etc) • Software (some code written: new!)
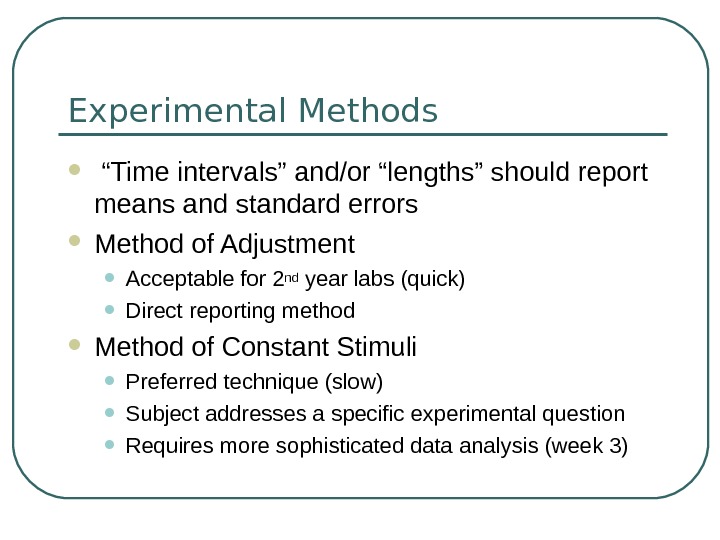
Experimental Methods “ Time intervals” and/or “lengths” should report means and standard errors Method of Adjustment • Acceptable for 2 nd year labs (quick) • Direct reporting method Method of Constant Stimuli • Preferred technique (slow) • Subject addresses a specific experimental question • Requires more sophisticated data analysis (week 3)
Aim To Use a good measure of performance — think carefully about what you’re measuring Use a standard experimental approach — best to use tried and tested methods Do a pilot experiment on your own group — iron out any problems in the procedure Address a question with an established literature — put your experiment in context
Avoid Making designs too complicated — think about final stats/ graphs needed — think about equipment/software needed Spending too much time programming — is a computer necessary? — is there a way of simplifying (eg powerpoint) — who can you ask for help with programming? — use the expertise of your demonstrator Working with small effects — try effects out on yourselves — read established literature Don’t test the ‘Null Hypothesis’ — ASK A CLEAR SCIENTIFIC QUESTION!
Useful Web Sites http: //en. wikipedia. org/wiki/Visual_illusions http: //en. wikipedia. org/wiki/Visual_search http: //www. michaelbach. de/ot/ http: //www. lifesci. sussex. ac. uk/home/George_Mather/Motion/ http: //www. richardgregory. org/experiments/index. htm