
1 Survey Research Maria Lucia Barron 2


- Размер: 200.5 Кб
- Количество слайдов: 46
Описание презентации 1 Survey Research Maria Lucia Barron 2 по слайдам
1 Survey Research Maria Lucia Barron
2 Outline Introduction Classification of surveys Steps in survey research Some problems in survey research References
3 Introduction. Survey ( noun ). STATISTICS analysis of poll sample: a statistical analysis of answers to a poll of a sample of a population, for example, to determine opinions, preferences, or knowledge. [1]. A method of gathering information from a sample of individuals. [2] A powerful, scientific tool for gathering accurate and useful information. [8] Gathering information, asking questions, and sample of population.
4 Definitions Census. Any count : any systematic count or survey. Count of population: an official count of a population carried out at set intervals. Sample. STATISTICS group selected for testing: a representative selection of a population that is examined to gain statistical information about the whole. [1] Random STATISTICS equally likely: relating or belonging to a set in which all the members have the same probability of occurrence. [1]
5 Surveys are related to: Sampling. (From where/whom are we getting the information) Interviewing. (How are we getting the information? ) Threats of validity. (What affect the validity of the results) Ethics. (Respect people’s opinion and confidential results. )
6 Why Are Surveys Conducted? Surveys provide an important source of basic scientific knowledge. Who may conducts a survey? Economists, psychologists, health professionals, political scientists, and others who need to get some information may conduct surveys to study such matters as income and expenditure patterns among households, the roots of ethnic or racial prejudice, the implications of health problems on people’s lives, comparative voting behavior, the effects on family life of women working outside the home, etc. . [2].
7 Requirements for Accurate Estimates[8] The sample is large enough to yield the desired level of precision. Everyone in the population has an equal (or known) chance of being selected for the sample. Questions are asked in ways that enable the people in the sample to respond willingly and accurately. The characteristics of people selected in the sampling process but who do not participate in the survey are similar to the characteristic of those who do.
8 Classification of Surveys By size (social, community and school surveys). [9] By result type (quantitative or qualitative). Time and population. [4]
9 Types of Survey [6] (Qualitative or Quantitative) Descriptive surveys are used to gather information largely on what people do and think. Thus a researcher might use this type of survey to find out what young people think about drugs, what drugs they might use, and with what frequency. Analytic surveys are used to answer research questions or to test hypotheses. A researcher might collect data from the general population which detailed information on health habits, e. G. Diet, exercise, smoking and so on. This information might then be used to make predictions concerning the state of health of the population at some future date. For example it might be possible to predict the amount of heart disease in a population ten years hence, based on this sort of data.
10 Qualitative vs Quantitative Focus group [2] Provide qualitative information A wide range of information can be gathered in a relative short time span. The moderator can explore related topics. Do not require complex sampling techniques. The sample is neither random nor representative of the population. The quality of the data is influenced by the skills of the moderator. Allow researchers to use actual words and behavior of the participants rather than counting response options. The analysis is truly qualitative.
11 Types of Surveys[4] (Time and Population) A. Cross-sectional surveys. Collect information from the sample at the same point time. B. Longitudinal surveys. Information is collected at different points in time in order to study changes in time. Trend study. Cohort study. Panel study.
12 Types of Longitudinal Surveys Trend study. Members of the population can change, sample many times over different points of time to see if any trend appear. Example. A researcher might be interested in the attitudes of high school principals toward the use of flexible scheduling. Population : high school principals in Brevard county. Instrument : questionnaire. Number of samples : 3 in a school year.
13 Types of Longitudinal Surveys Cohort study. Members of the population do not change, but maybe members surveyed change. Example. The CS head department of FIT wants to know the importance of teaching OO methodologies and languages. Population : CS graduated from FIT from 1990 to 1999. Instrument : questionnaire. Number of samples : 2 in a year.
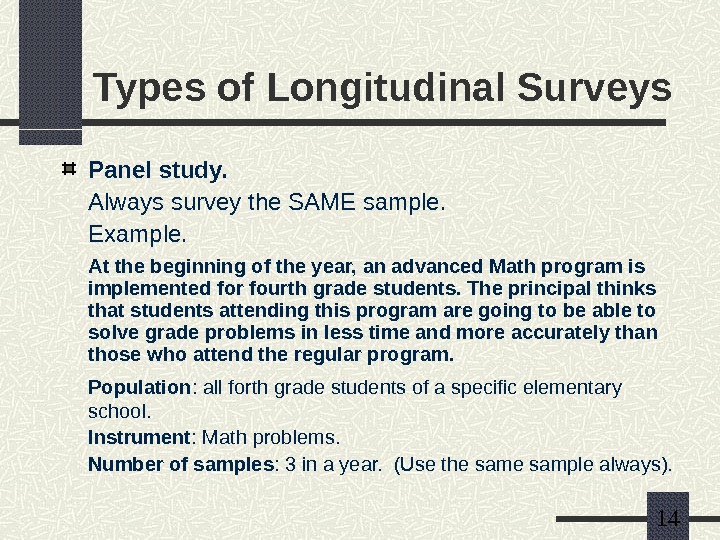
14 Types of Longitudinal Surveys Panel study. Always survey the SAME sample. Example. At the beginning of the year, an advanced Math program is implemented for fourth grade students. The principal thinks that students attending this program are going to be able to solve grade problems in less time and more accurately than those who attend the regular program. Population : all forth grade students of a specific elementary school. Instrument : Math problems. Number of samples : 3 in a year. (Use the sample always).
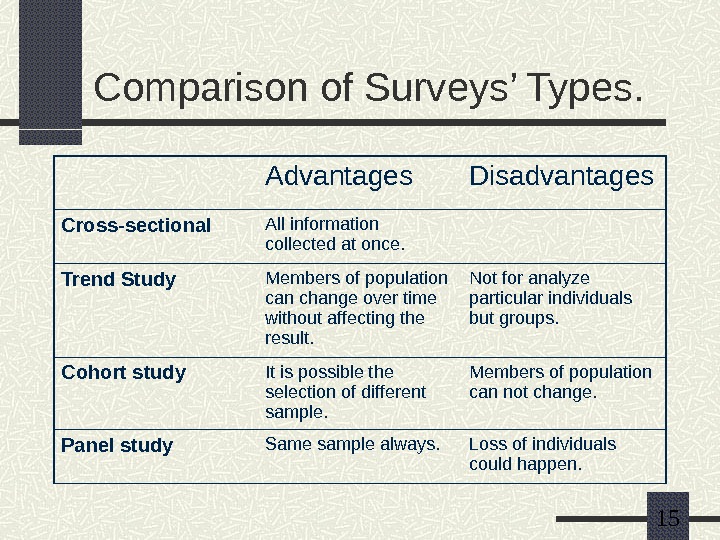
15 Comparison of Surveys’ Types. Advantages Disadvantages Cross-sectional All information collected at once. Trend Study Members of population can change over time without affecting the result. Not for analyze particular individuals but groups. Cohort study It is possible the selection of different sample. Members of population can not change. Panel study Same sample always. Loss of individuals could happen.
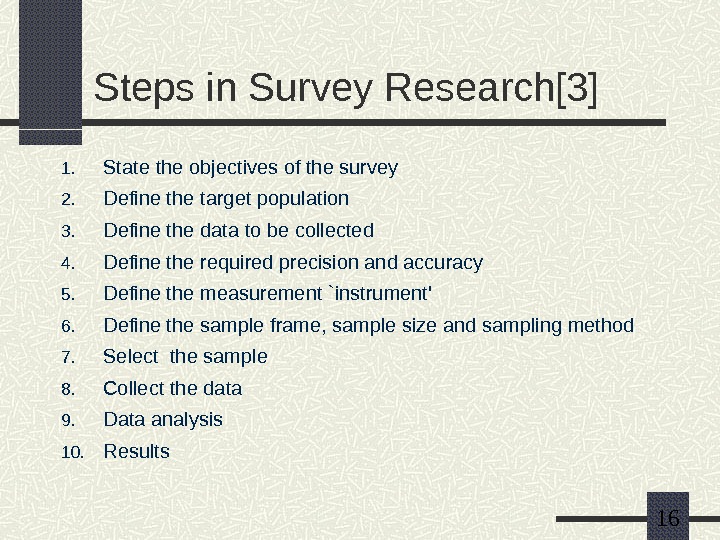
16 Steps in Survey Research[3] 1. State the objectives of the survey 2. Define the target population 3. Define the data to be collected 4. Define the required precision and accuracy 5. Define the measurement `instrument’ 6. Define the sample frame, sample size and sampling method 7. Select the sample 8. Collect the data 9. Data analysis 10. Results
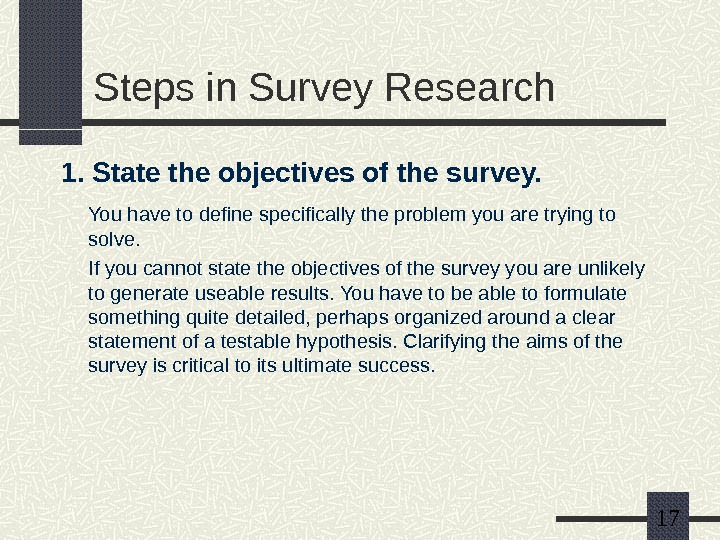
17 Steps in Survey Research 1. State the objectives of the survey. You have to define specifically the problem you are trying to solve. If you cannot state the objectives of the survey you are unlikely to generate useable results. You have to be able to formulate something quite detailed, perhaps organized around a clear statement of a testable hypothesis. Clarifying the aims of the survey is critical to its ultimate success.
18 Steps in Survey Research 2. Define the target population. Defining the target population can be relatively simple, especially for finite populations, however, it may be more difficult to define what constitutes ‘natural’ membership of the population; In that case, arbitrary decisions have to be made. The process of defining the population is quite different when dealing with continuous (rather than discrete ) phenomena. As you will see, it is still possible to define a sample size even if you don’t know the proportion of the population that the sample represents.
19 Steps in Survey Research 3. Define the data to be collected. What new information do you need to solve the problem? Hint: prepare hypothetical tables of results. They help us to separate “need to know” than “nice to know”. Focus groups can help to find out which questions to ask in a survey. But they can not substitute surveys.
20 Steps in Survey Research 4. Define the required precision and accuracy The most subjective stage is defining the precision with which the data should be collected. Strictly speaking, the precision can only be correctly estimated if we conduct a census. The precision provided by a sample survey is an estimate the ‘tightness’ of the range of estimates of the population characteristics provided by various samples. When we estimate a population value from a sample we can only work out how accurate the sample estimate is if we actually know the correct value — which we rarely do — but we can estimate the ‘likely’ accuracy. We need to design and select the sample in such a way that we obtain results that have acceptable precision and accuracy
21 Steps in Survey Research 5. Define the measurement `instrument‘. The measurement instrument is the method — interview, observation, questionnaire — by which the survey data is generated. To produce useful information the ideas that motivated the survey must be translated into good questions.
22 Define what kind of information Clarify what kind of information you are looking for. What people do or what they are: their behavior or attributes. What people say they want or what they think is true: their attitudes or beliefs.
23 Analyze the Different Ways of Communication. Visual (mail). Hear (telephone). All forms (face to face interview).
24 Kind of Question Structure. Which kind of question structure to use? Open-ended. Close-ended with ordered choices. Close-ended with unordered response choices. Partially closed-ended.
25 The Questionnaire[5] A effective questionnaire will follow this rules: It should be as brief as possible. The information asked for must be otherwise inaccessible to the investigator. The subject inquired about must not be a trivial one but must have importance enough to justify the time and the effort involved. The questions ought to be aimed at obtaining factual data, rather than opinions, impressions, or estimates. The wording of every item ought to be understandable and familiar, in order to insure the respondent’s comprehension of what is being asked. For the same reason, the items should be arranged in a neat and logical order. The questionnaire should be conveniently planned and set up to take a minimum of the respondent’s time. Clear instructions must be included as to the way the answers are to be indicated.
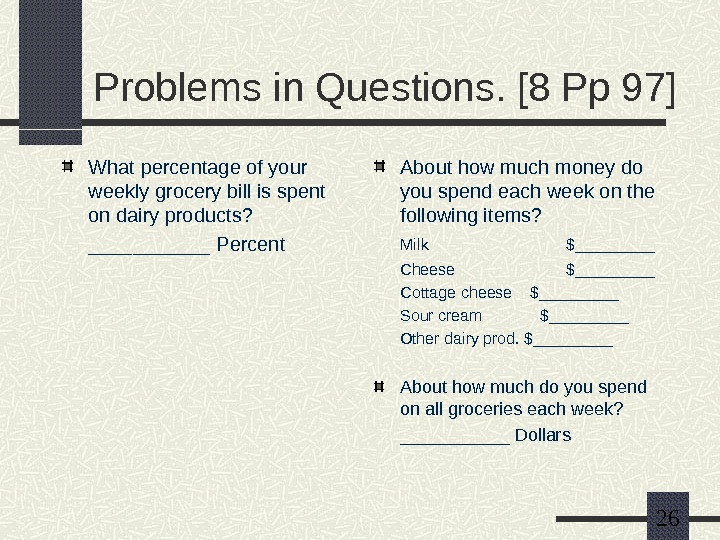
26 Problems in Questions. [8 Pp 97] What percentage of your weekly grocery bill is spent on dairy products? ______ Percent About how much money do you spend each week on the following items? Milk $_____ Cheese $_____ Cottage cheese $_____ Sour cream $_____ Other dairy prod. $_____ About how much do you spend on all groceries each week? ______ Dollars
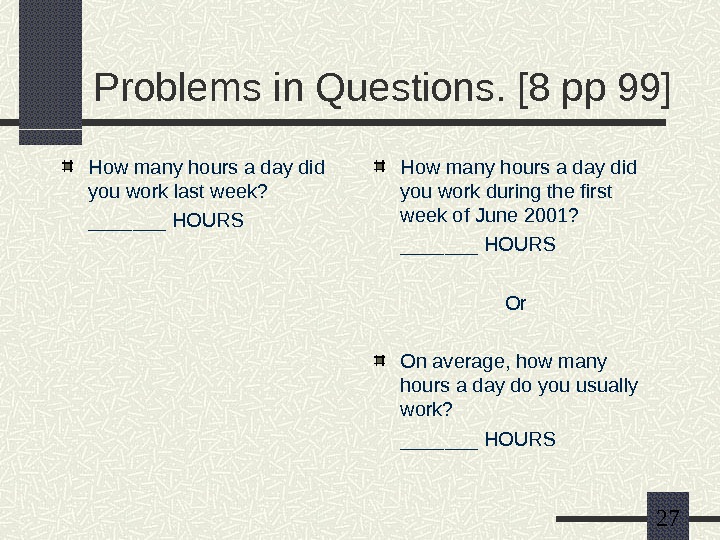
27 Problems in Questions. [8 pp 99] How many hours a day did you work last week? _______ HOURS How many hours a day did you work during the first week of June 2001? _______ HOURS Or On average, how many hours a day do you usually work? _______ HOURS
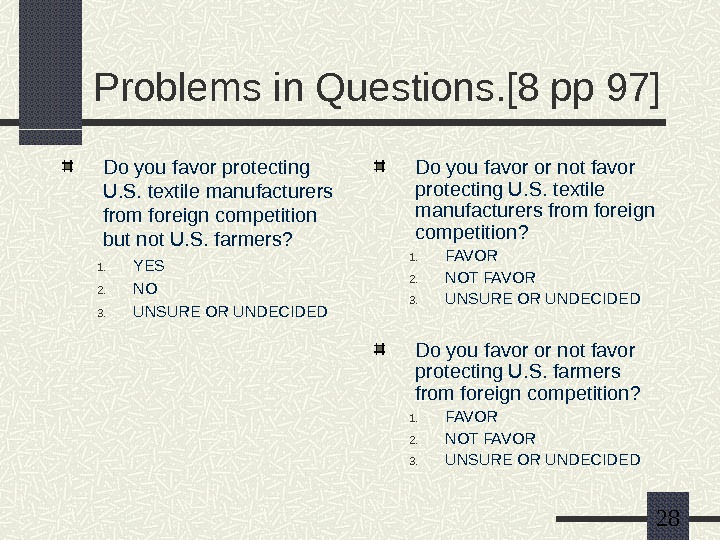
28 Problems in Questions. [8 pp 97] Do you favor protecting U. S. textile manufacturers from foreign competition but not U. S. farmers? 1. YES 2. NO 3. UNSURE OR UNDECIDED Do you favor or not favor protecting U. S. textile manufacturers from foreign competition? 1. FAVOR 2. NOT FAVOR 3. UNSURE OR UNDECIDED Do you favor or not favor protecting U. S. farmers from foreign competition? 1. FAVOR 2. NOT FAVOR 3. UNSURE OR UNDECI
29 Steps in Survey Research 6. Define the sample frame, sample size and sampling method. The sample frame is the list of people (‘objects’ for inanimate populations) that make up the target population; It is a list of the individuals who meet the ‘requirements’ to be a member of that population. The sample is selected from the sample frame by specifying the sample size (either as a finite number, or as a proportion of the population). The sampling method is the process by which we choose the members of the sample.
30 Steps in Survey Research 7. Select the sample. The sample is selected, using the sample method defined, from the sample frame by specifying the sample size. The process of generating a sample requires several critical decisions to be made. Mistakes at this stage will compromise — and possibly invalidate — the entire survey. These decisions are concerned with the sample frame , the sample size , and the sampling method.
31 Types of Errors. Coverage error occurs when the list (or frame) from which a sample is drawn does not include all elements of the population that researchers wish to study. Sampling error occurs when researchers survey only a subset or sample of all people in the population instead of conducting a census. Measurement error occurs when a respondent’s answer to a giving question is inaccurate, imprecise, or can not be compared in any useful way to other respondent’s answers. Nonresponse error occurs when a significant number of people in the survey sample do not respond to the questionnaire and are different from those who do in a way that is important to the study.
32 Errors Examples. Prior to the 1936 united states presidential election, pollsters for the magazine Literary Digest mailed postcards to more than 10 million people who were listed in telephone directories or as registered owners of automobiles. The cards asked for whom they intended to vote. Based on the more than 2 million ballots that were returned, the Literary Digest digest predicted that republican candidate Alfred M. Landon would win in a landslide over democrat Franklin D. Roosevelt. At the time, however, more republicans than democrats owned telephones and automobiles, skewing the poll results. In the election, Landon won only two states.
33 Errors Examples. Interviewer: The President recently increased the number of U. S. troops in the Persian Gulf. Do you or do you not support this action? Respondent: By “support” do you mean I go to the Gulf or do I think it’s a good idea? Interviewer: I mean you would go. Respondent: No.
34 Errors examples. When asked about “welfare, ” a majority of Americans in one survey said that the government spends too much money. But when asked about “assistance to the poor, ” significantly fewer people gave this response.
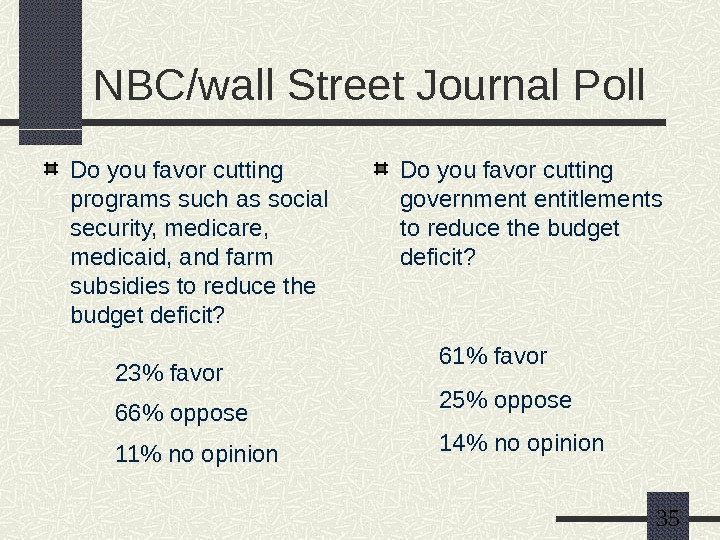
35 NBC/wall Street Journal Poll Do you favor cutting programs such as social security, medicare, medicaid, and farm subsidies to reduce the budget deficit? 23% favor 66% oppose 11% no opinion Do you favor cutting government entitlements to reduce the budget deficit? 61% favor 25% oppose 14% no opinion
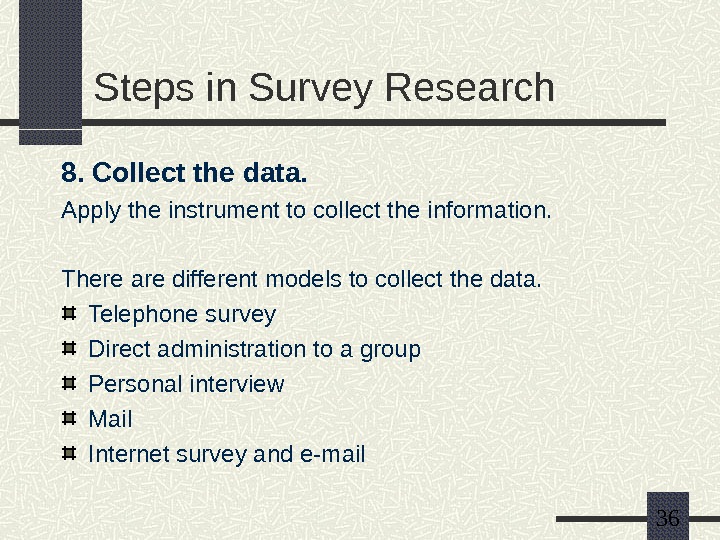
36 Steps in Survey Research 8. Collect the data. Apply the instrument to collect the information. There are different models to collect the data. Telephone survey Direct administration to a group Personal interview Mail Internet survey and e-mail
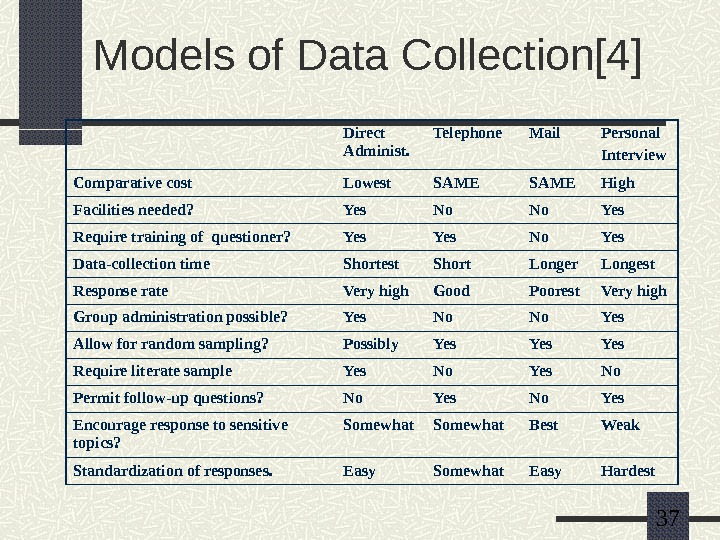
37 Models of Data Collection[4] Direct Administ. Telephone Mail Personal Interview Comparative cost Lowest SAME High Facilities needed? Yes No No Yes Require training of questioner? Yes No Yes Data-collection time Shortest Short Longer Longest Response rate Very high Good Poorest Very high Group administration possible? Yes No No Yes Allow for random sampling? Possibly Yes Yes Require literate sample Yes No Permit follow-up questions? No Yes Encourage response to sensitive topics? Somewhat Best Weak Standardization of responses. Easy Somewhat Easy Hardest
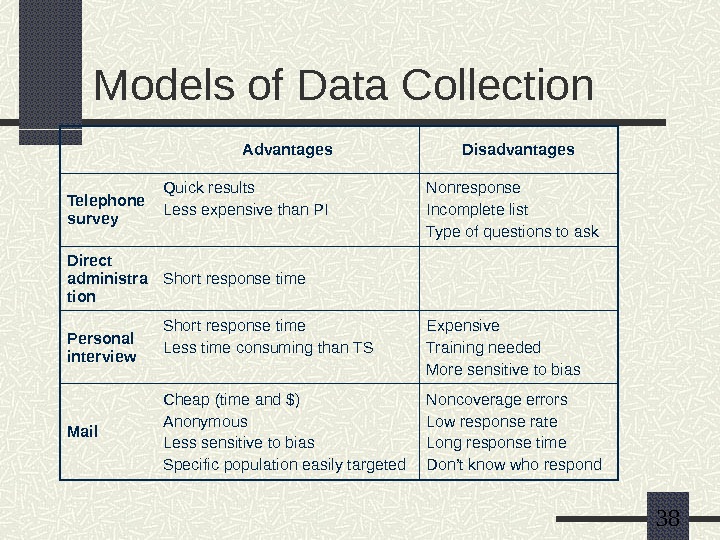
38 Models of Data Collection Advantages Disadvantages Telephone survey Quick results Less expensive than PI Nonresponse Incomplete list Type of questions to ask Direct administra tion Short response time Personal interview Short response time Less time consuming than TS Expensive Training needed More sensitive to bias Mail Cheap (time and $) Anonymous Less sensitive to bias Specific population easily targeted Noncoverage errors Low response rate Long response time Don’t know who respond
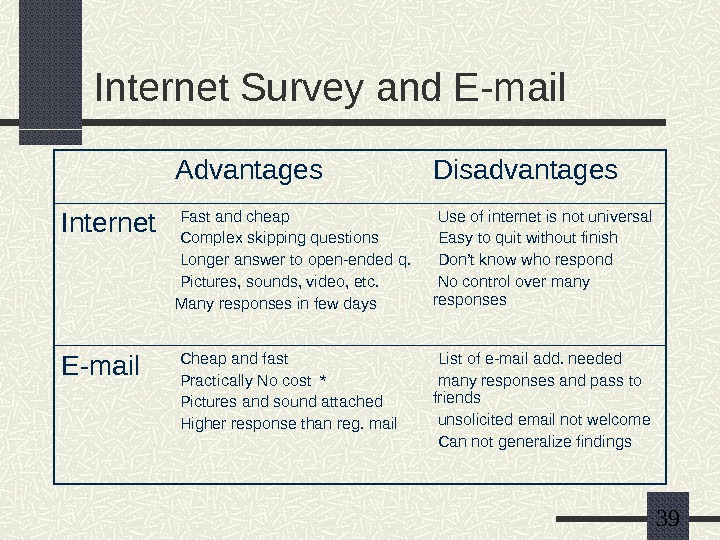
39 Internet Survey and E-mail Advantages Disadvantages Internet Fast and cheap Complex skipping questions Longer answer to open-ended q. Pictures, sounds, video, etc. Many responses in few days Use of internet is not universal Easy to quit without finish Don’t know who respond No control over many responses E-mail Cheap and fast Practically No cost * Pictures and sound attached Higher response than reg. mail List of e-mail add. needed many responses and pass to friends unsolicited email not welcome Can not generalize findings
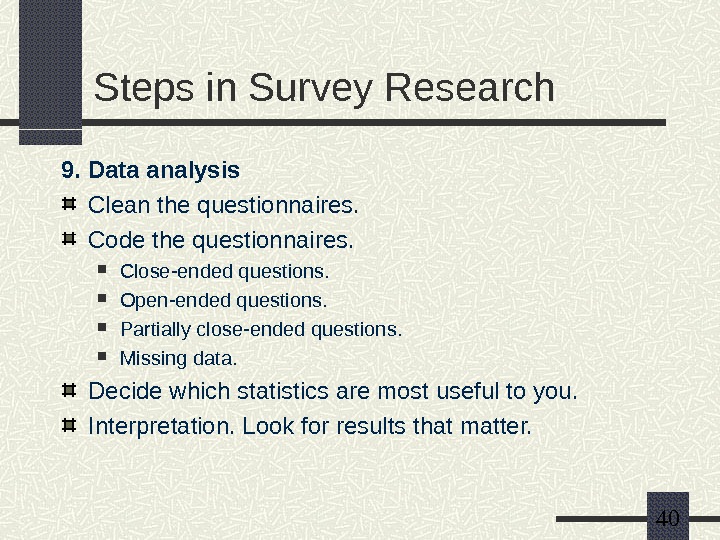
40 Steps in Survey Research 9. Data analysis Clean the questionnaires. Code the questionnaires. Close-ended questions. Open-ended questions. Partially close-ended questions. Missing data. Decide which statistics are most useful to you. Interpretation. Look for results that matter.
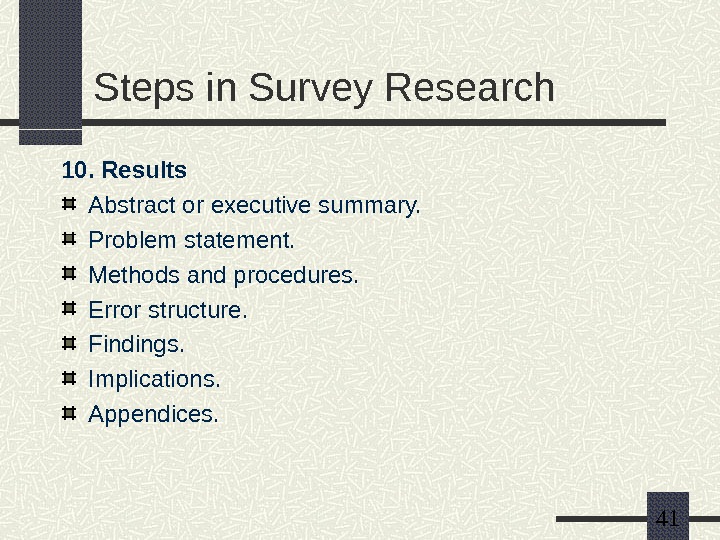
41 Steps in Survey Research 10. Results Abstract or executive summary. Problem statement. Methods and procedures. Error structure. Findings. Implications. Appendices.
42 Some Problems in Survey Research. Nonresponse. Why is this a problem? Those that do not respond will very likely differ from the respondents with regards to answers to the survey questions. Total nonresponse. A questionnaire is missing (not returned). Item nonresponse. A specific item of the questionnaire is missing (not answered).
43 Suggestions for increasing response rate: Use multiple contacts including: Send a preliminary announcing the survey. Mali the survey to all respondents at the same time. Send a remainder. (First-Class or Priority Mail) Send an acknowledgment card thanking respondents. Use printed stationery and personalized letters. Include a stamped, pre-addressed return envelope. Include a token of thanks —$1 to $5 —with your initial questionnaire as an incentive. [2]
44 Some Problems in Survey Research. Problems in the Instrumentation Process in SR Several threats to the validity of the instrumentation process in surveys can cause individuals to respond differently than they might otherwise. Examples: Extraneous events (a fire drill). Leading or insensitive questions. Vocabulary used. Different conditions (dinner time, poorly lit rooms, etc. ).
45 Some Problems in Survey Research. Threats to Internal Validity Mortality. — Arise in longitudinal studies. Location. — Arise if places, where data is collected, may affect responses. Instrumentation. -. Instrument decay. Can arise if the interviewer get tired or are rushed.
46 References 1. Encarta® world English dictionary [north American edition] © & (P) 2001 Microsoft corporation. All rights reserved. 2. Brochure, what is a survey? , Bill Kalsbeek , 1995 publications officer, ASA section on survey research methods. 3. http: //www. deakin. edu. au/~ agoodman /sci 101/#RTFTo. C 2. Developed by Albert Goodman s chool of computing and mathematics Deakin university copyright © Deakin university (1995, 1999). 4. Frankel, J. And Wallen, N. . How to design and valuate research in education. Mc. Graw. Hill (2000). 5. Hillway, T. Introduction to research. H. M. Co. (1964). 6. Http: //www. chssc. salford. Ac. uk/health. Sci/resmeth 2000/resmeth/ch 2 surv. htm Research methods for health science. 7. «Psychology». Microsoft® Encarta® online encyclopedia 2001 http: //encarta. Msn. Com (13 mar. 2002). 8. Salant, P. and Dillman, D. How to conduct your own survey. Wiley (1994).