1 SAMPLING AND DATA QUALITY OBJECTIVES FOR ENVIRONMENTAL


5_sampling_and_dЂ’Ђ__quality_objectives_for_environmental_monitoring.ppt
- Размер: 4.3 Мб
- Автор:
- Количество слайдов: 39
Описание презентации 1 SAMPLING AND DATA QUALITY OBJECTIVES FOR ENVIRONMENTAL по слайдам
 1 SAMPLING AND DATA QUALITY OBJECTIVES FOR ENVIRONMENTAL MONITORING
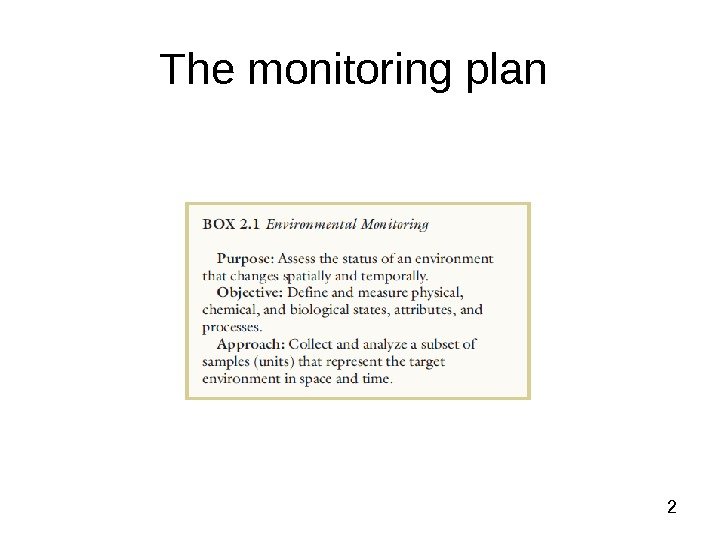
 2 The monitoring plan
 3 Useful Terms and their Definitions • Measurement: Also referred to as observation. The common term is sample, which is defined as ‘‘a small part of anything’’ or a specimen. • Sampling: Act of testing, making a measurement, selecting a sample, making an observation, or taking a measurement or a specimen. • Sample Support: Amount of sample collected or used for measurements. This is a term frequently used by statisticians. For our purposes in this textbook it is synonymous with the term ‘‘sample. ’’ • Attribute: Defined as a specific aspect or quality of a measurement such as color, size, or a chemical concentration. • Population: Defined as a group of similar units (see the ‘‘Representative Units’’ section).
 4 Useful Terms and their Definitions • Pattern: An environment with unique features or special characteristics. • Physical parameter: A property associated with the physical component of the environment; it includes topography; surface water and groundwater distributions; quality, cycles, and gradients; heat temperature distributions; wind direction changes; and intensity. • Chemical parameter: A property associated with the chemical component of the environment; • Biological parameter: A property associated with the biological component of the environment that includes plant cover, density, and distribution; water quality indicator parameters such as coliform bacteria; and soil microbe population densities such as fungi or heterotrophic bacteria. • Process: An action or series of actions involving physical, chemical, or biological entities, such as water flow, microbial growth, pollutant degradation, mineral weathering, and oxidation-reduction reactions.
 5 SPATIAL PROPERTIES • The collection of samples at multiple depths or altitude intervals adds a third dimension (Z) to two-dimensional (2 -D) sampling. It is possible to collect samples at random intervals down a soil/geological profile. However, most of the time, either discrete sampling (at fixed intervals) or stratified sampling (defined by geologic layers) is chosen. In the laboratory, cores are visually inspected and often separated in layers. Similarly, for atmospheric measurements a priori knowledge of possible temperature inversions, winds, and turbulent layers helps atmospheric scientists define sampling locations, altitudes, and ranges.
 6 TEMPORAL PROPERTIES • Usually sample collection or measurements over time are defined with natural cycles such as daytime; nighttime; or daily, seasonal, or yearly intervals. Additionally, more precise intervals are sometimes simply defined in convenient time units such as seconds (or fractions), minutes, hours, weeks, or months. Therefore most temporal sampling programs can be defined as systematic because they are usually carried out at regular intervals. For example, groundwater monitoring at landfill sites is often done once every 4 months over a year.
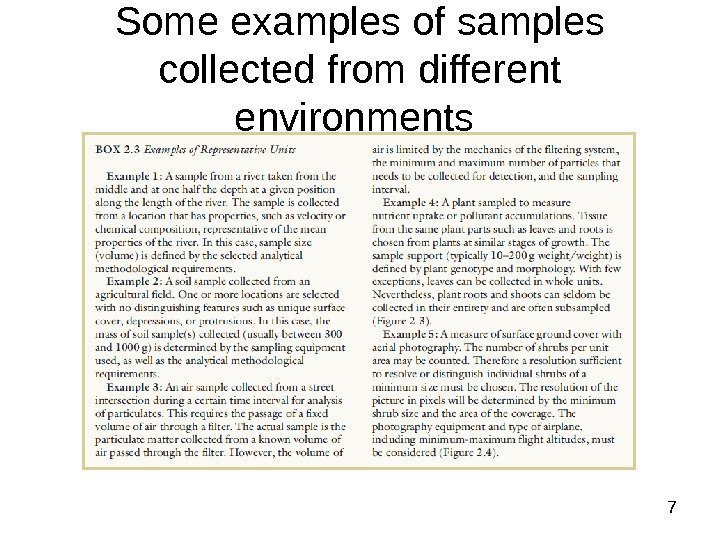
 7 Some examples of samples collected from different environments
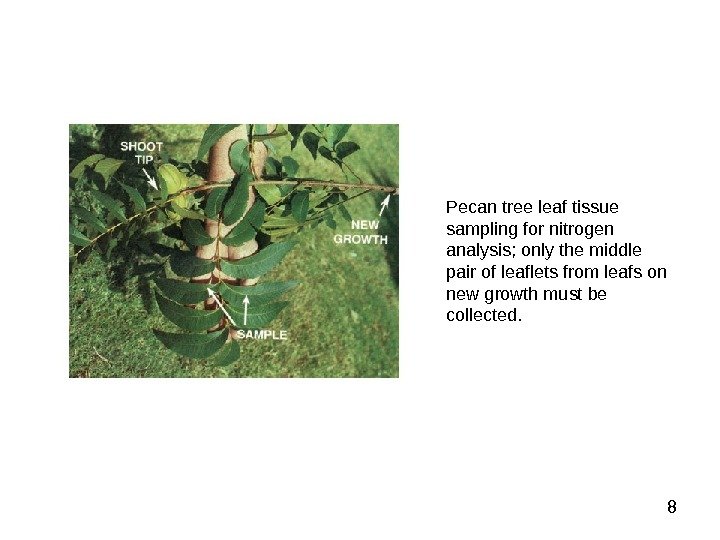
 8 Pecan tree leaf tissue sampling for nitrogen analysis; only the middle pair of leaflets from leafs on new growth must be collected.
 9 SAMPLING LOCATIONS • Statistical-based monitoring plans require environmental scientists to collect samples from an environment at statistically determined locations. • Random: Sampling location selected at random. All units have the same chance of being selected. • Systematic: This approach is a subset of random sampling if the initial sampling locations are selected randomly
 10 SAMPLING LOCATIONS • Grab, Search, or Exploratory: Typically used in pollution monitoring and may include the collection of one or two samples to try to identify the type of pollution or presence/absence of a pollutant. This haphazard approach of sampling is highly suspect and should be accepted only for the purposes previously stated. • Surrogate: Done in cases where the substitution of one measurement is possible for another at a reduced cost. • Composite (bulking): Commonly done to reduce analytical costs in sampling schemes where the spatial or temporal variances are not needed. • Path Integrated: Used in open path infrared (IR) and ultraviolet (UV) spectroscopy air chemical analysis. • Time Integrated: Commonly used in weather stations that measure ambient air properties such as temperature and wind speed, but report time-averaged hourly and daily values. • Remote sensing: Commonly used to collect two-dimensional photographs of the earth surface passive radiation using IR, UV, and Vis light sensors
 11(A) Simple random sampling. (B) Systematic grid sampling (dots) and random sampling within each grid block (x). (C) Stratified random sampling (soil, plants, etc. ) (x) within each section of the watershed, stratified systematic sampling of the water in tributaries and river (dots). (D) Search sampling of volatile gases (VOAs) associated with a subsurface plume of volatile contaminants with a vapor detector above surface.

 13 Quality Control: • a) Blanks are collected to make sure that containers or the preservation techniques are not contaminating the samples. • b) Trip samples are blank samples carried during a sampling trip. • c) Sample replicates are collected to check the precision of the sampling procedure: preservation and contamination. • d) Split samples are usually collected for archival purposes.
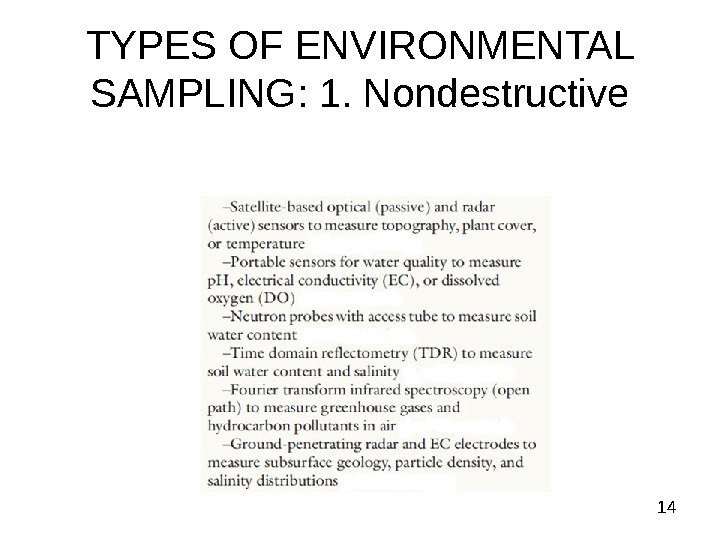
 14 TYPES OF ENVIRONMENTAL SAMPLING: 1. Nondestructive

 16 Elements of a Sampling Plan with Data Quality Objectives • Number and types of samples collected in space and time. This section should discuss the statistical basis for the number of samples and sampling patterns selected. • Actual costs of the plan, including sample collection, analysis and interpretation. A cost analysis that provides a measure of the cost versus effectiveness of the plan. Alternate approaches can also be included. Sampling costs are determined by the precision and accuracy of the results. • Data quality control and objectives are also needed in a sampling plan. • Quality: Discuss statistical measures of:
 17 Quality: • Accuracy (bias): How data will be compared with reference values when known. Estimate overall bias of the project based on criteria and assumptions made. • Precision: Discuss the specific (sampling methods, instruments, measurements) variances and overall variances of the data or data sets when possible using relative standard deviations or percent coefficient of variation (%CV). • Defensible: Ensure that sufficient documentation is available after the project is complete to trace the origins of all data. • Reproducible: Ensure that the data can be duplicated by following accepted sampling protocols, methods of analyses, and sound statistical evaluations. • Representative: Discuss the statistical principles used to ensure that the data collected represents the environment targeted in the study. • Useful: Ensure that the data generated meets regulatory criteria and sound scientific principles. • Comparable: Show similarities or differences between this and other data sets, if any. • Complete: Address any incomplete data and how this might affect decisions derived from these data.
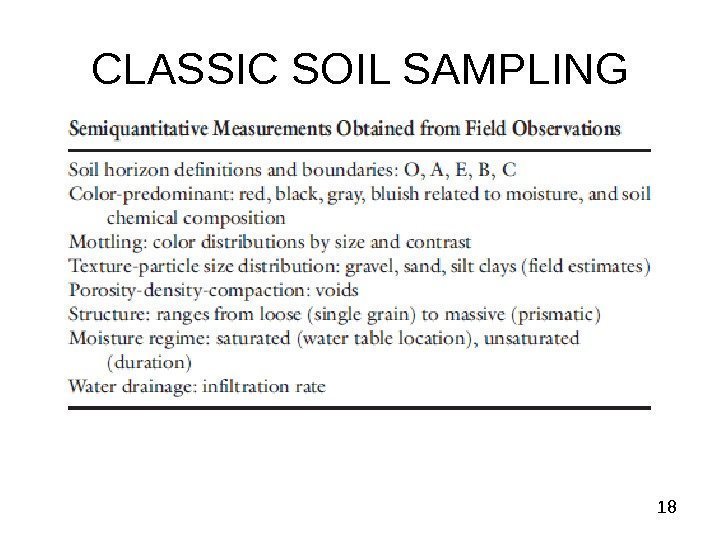
 18 CLASSIC SOIL SAMPLING
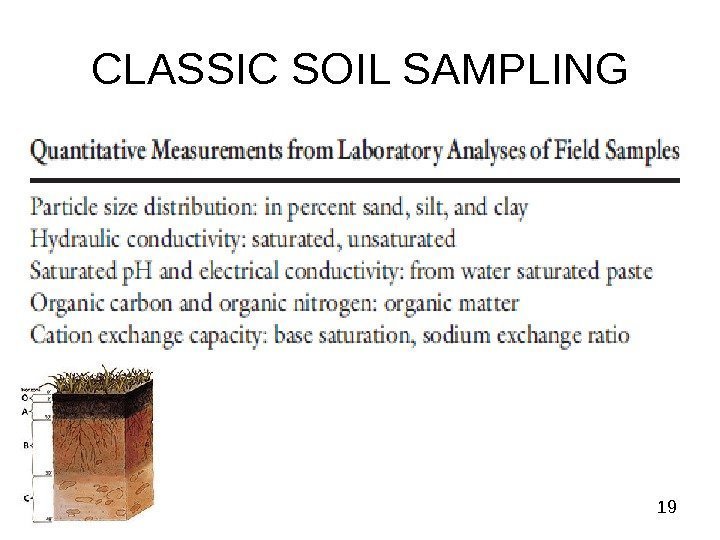
 19 CLASSIC SOIL SAMPLING
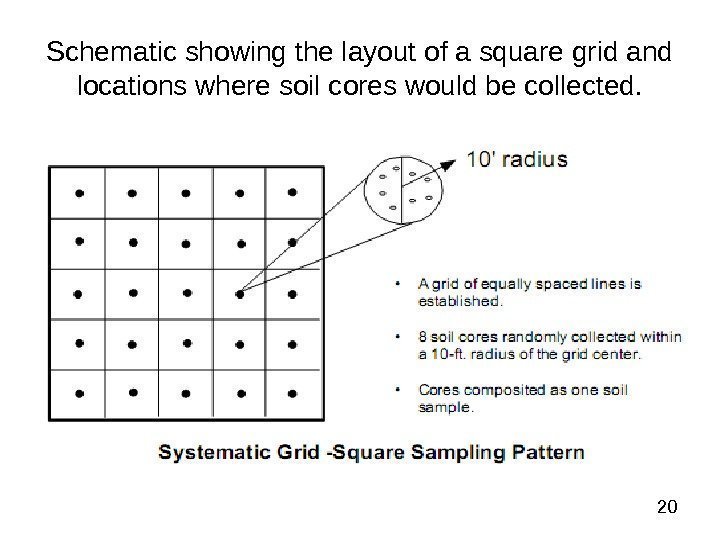
 20 Schematic showing the layout of a square grid and locations where soil cores would be collected.
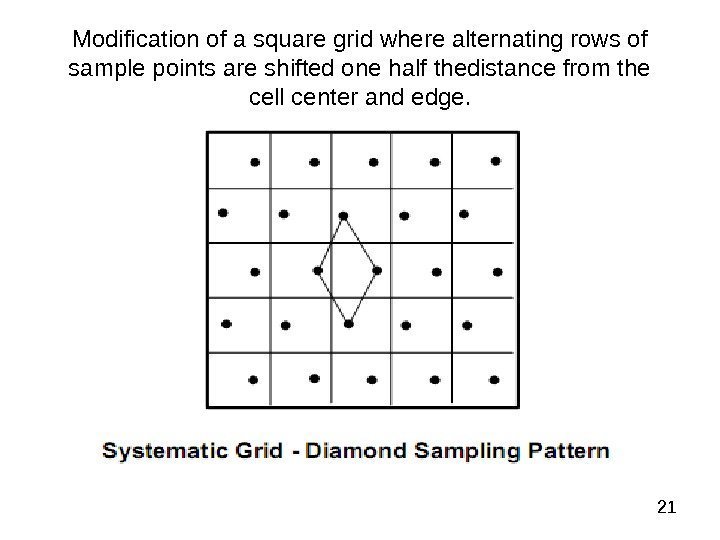
 21 Modification of a square grid where alternating rows of sample points are shifted one half thedistance from the cell center and edge.
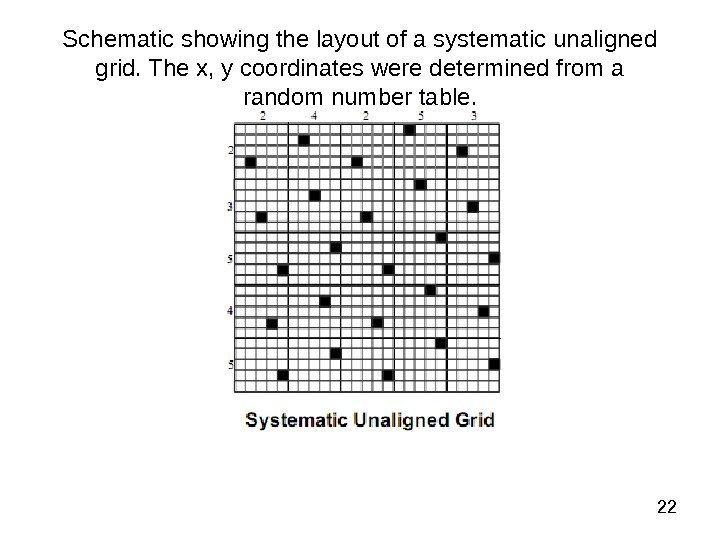
 22 Schematic showing the layout of a systematic unaligned grid. The x, y coordinates were determined from a random number table.
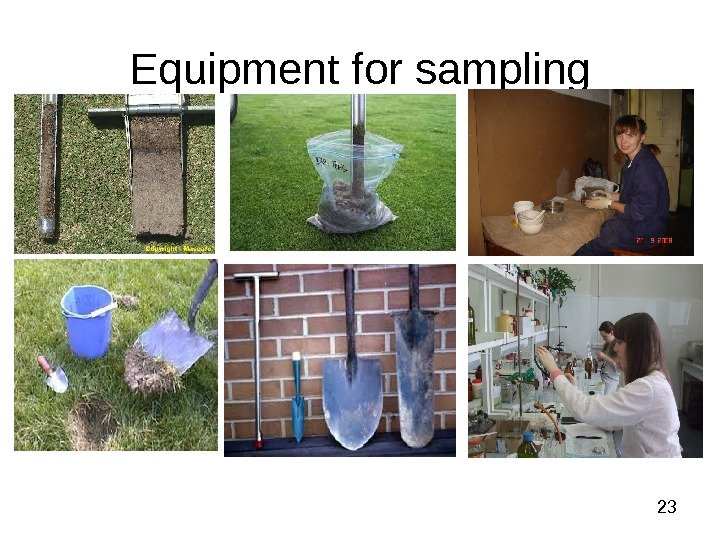
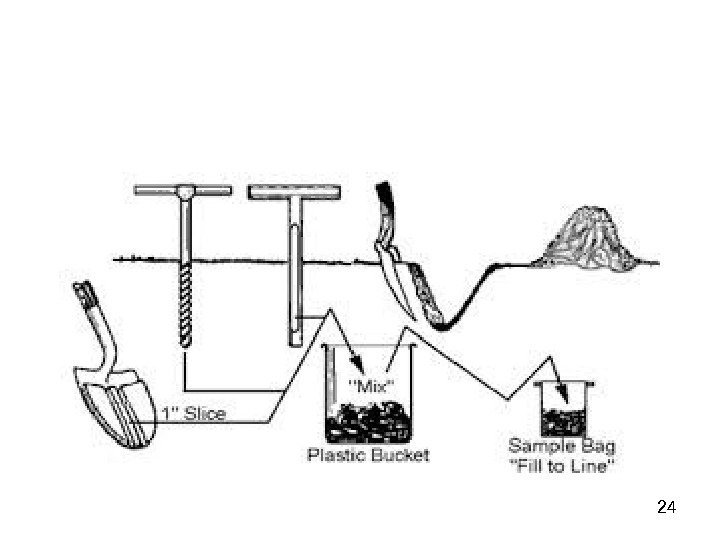
 23 Equipment for sampling

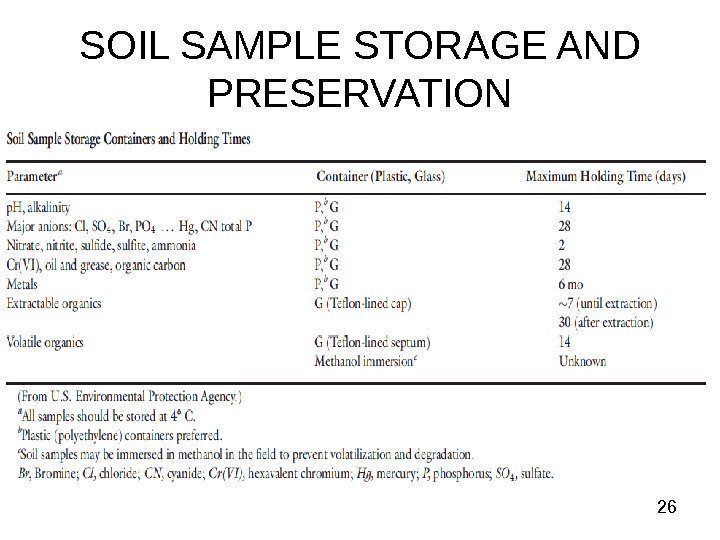
 25 SOIL SAMPLE STORAGE AND PRESERVATION Soil samples collected for issues related to contamination, public health, and risk and safety assessment usually require special procedures. Typically, samples are not allowed to dry and are collected and preserved ‘‘as is, ’’ meaning that soil moisture and chemical field conditions are maintained. Therefore these soil samples are usually collected in glass or plastic jars, sealed, and kept cool. Cooling the samples to near freezing is also necessary to reduce biological activity. Freezing soil samples, although sometimes done, is not recommended because freezing will change the biological and perhaps even the physical nature of the soil medium. No chemical preservatives are added to soil samples.
 26 SOIL SAMPLE STORAGE AND PRESERVATION
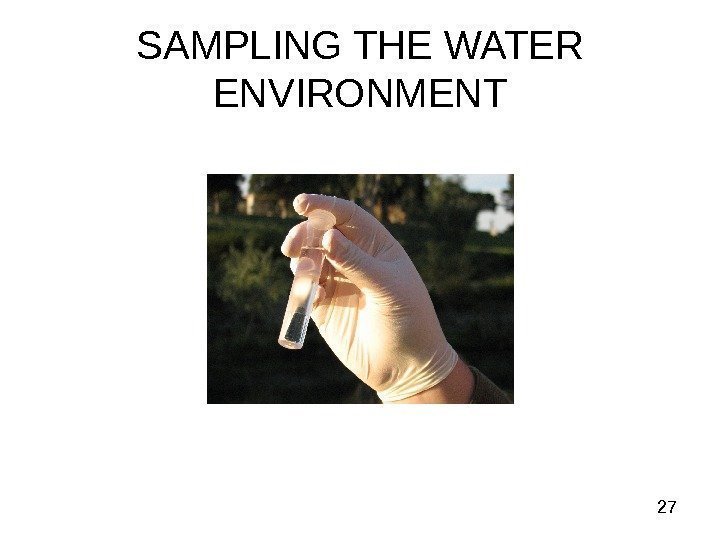
 27 SAMPLING THE WATER ENVIRONMENT
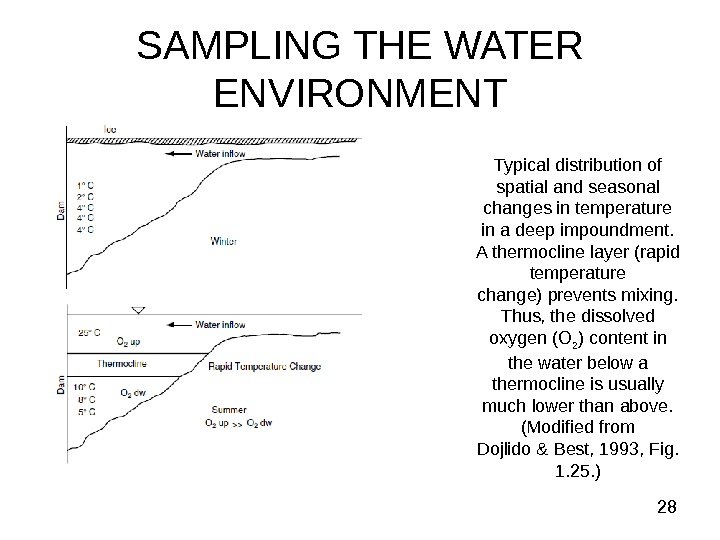
 28 SAMPLING THE WATER ENVIRONMENT Typical distribution of spatial and seasonal changes in temperature in a deep impoundment. A thermocline layer (rapid temperature change) prevents mixing. Thus, the dissolved oxygen (O 2 ) content in the water below a thermocline is usually much lower than above. (Modified from Dojlido & Best, 1993, Fig. 1. 25. )

 30 Location of sampling points • Sampling points should be selected such that the samples taken are representative of the different sources from which water is obtained by the public or enters the system. • These points should include those that yield samples representative of the conditions at the most unfavourable sources or places in the supply system, particularly points of possible contamination such as unprotected sources, loops, reservoirs, low-pressure zones, ends of the system, etc. • Sampling points should be uniformly distributed throughout a piped distribution system, taking population distribution into account; the number of sampling points should be proportional to the number of links or branches. •
 31 Location of sampling points • The points chosen should generally yield samples that are representative of the system as a whole and of its main components. • Sampling points should be located in such a way that water can be sampled from reserve tanks and reservoirs, etc. • In systems with more than one water source, the locations of the sampling points should take account of the number of inhabitants served by each source. • There should be at least one sampling point directly after the clean-water outlet from each treatment plant.
 32 Sampling sites. • fixed and agreed with the supply agency; • fixed, but not agreed with the supply agency; • random or variable
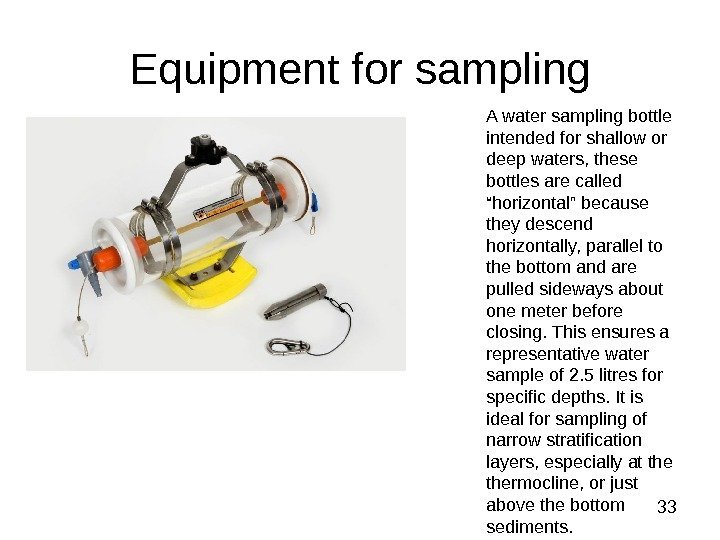
 33 Equipment for sampling A water sampling bottle intended for shallow or deep waters, these bottles are called “horizontal” because they descend horizontally, parallel to the bottom and are pulled sideways about one meter before closing. This ensures a representative water sample of 2. 5 litres for specific depths. It is ideal for sampling of narrow stratification layers, especially at thermocline, or just above the bottom sediments.
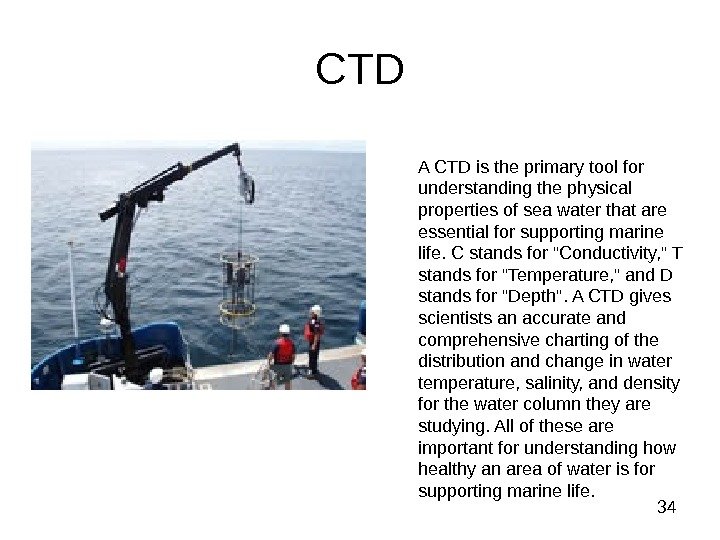
 34 CTD A CTD is the primary tool for understanding the physical properties of sea water that are essential for supporting marine life. C stands for «Conductivity, » T stands for «Temperature, » and D stands for «Depth». A CTD gives scientists an accurate and comprehensive charting of the distribution and change in water temperature, salinity, and density for the water column they are studying. All of these are important for understanding how healthy an area of water is for supporting marine life.
 35 SAMPLING THE AIR ENVIRONMENT • Depending on the contaminants of concern, air samples may be collected using several techniques, including: whole air sampling, solid sorbent sampling (active or passive), impinger sampling, and filter sampling. •
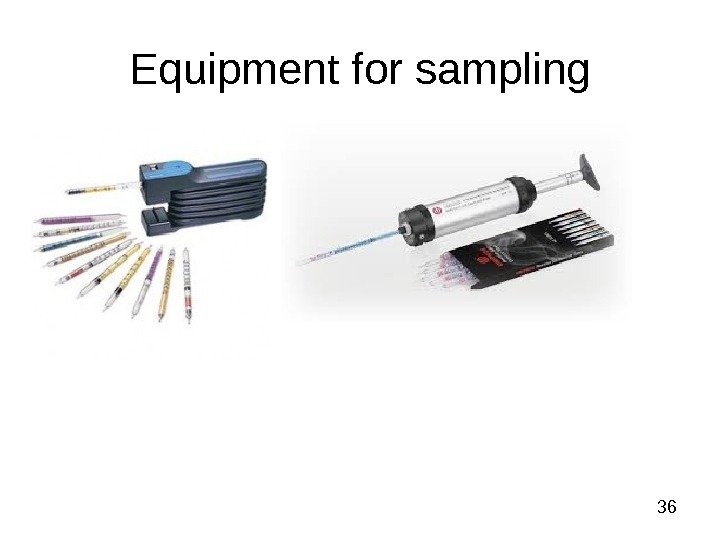
 36 Equipment for sampling
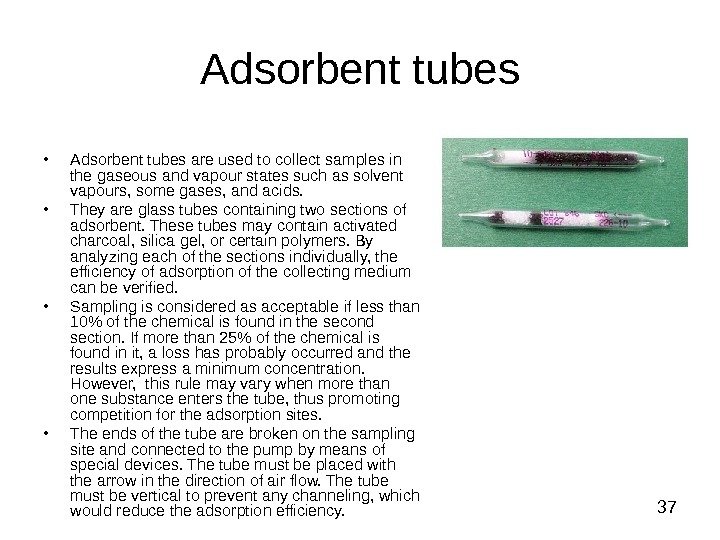
 37 Adsorbent tubes • Adsorbent tubes are used to collect samples in the gaseous and vapour states such as solvent vapours, some gases, and acids. • They are glass tubes containing two sections of adsorbent. These tubes may contain activated charcoal, silica gel, or certain polymers. By analyzing each of the sections individually, the efficiency of adsorption of the collecting medium can be verified. • Sampling is considered as acceptable if less than 10% of the chemical is found in the second section. If more than 25% of the chemical is found in it, a loss has probably occurred and the results express a minimum concentration. However, this rule may vary when more than one substance enters the tube, thus promoting competition for the adsorption sites. • The ends of the tube are broken on the sampling site and connected to the pump by means of special devices. The tube must be placed with the arrow in the direction of air flow. The tube must be vertical to prevent any channeling, which would reduce the adsorption efficiency.
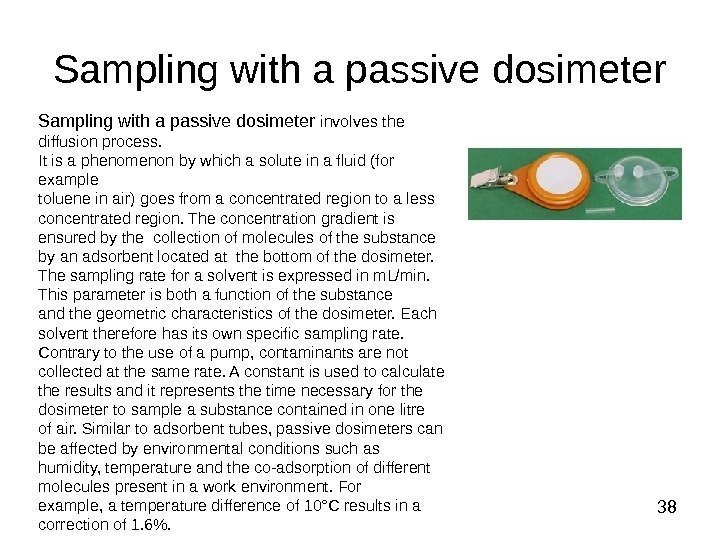
 38 Sampling with a passive dosimeter involves the diffusion process. It is a phenomenon by which a solute in a fluid (for example toluene in air) goes from a concentrated region to a less concentrated region. The concentration gradient is ensured by the collection of molecules of the substance by an adsorbent located at the bottom of the dosimeter. The sampling rate for a solvent is expressed in m. L/min. This parameter is both a function of the substance and the geometric characteristics of the dosimeter. Each solvent therefore has its own specific sampling rate. Contrary to the use of a pump, contaminants are not collected at the same rate. A constant is used to calculate the results and it represents the time necessary for the dosimeter to sample a substance contained in one litre of air. Similar to adsorbent tubes, passive dosimeters can be affected by environmental conditions such as humidity, temperature and the co-adsorption of different molecules present in a work environment. For example, a temperature difference of 10°C results in a correction of 1. 6%.
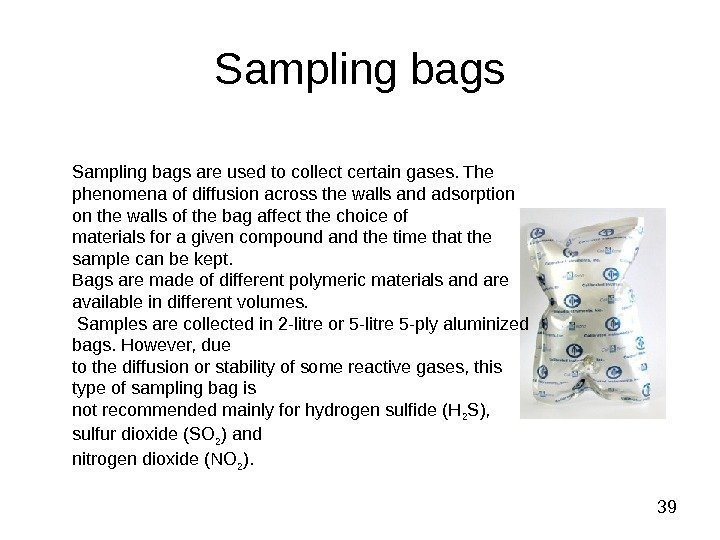
 39 Sampling bags are used to collect certain gases. The phenomena of diffusion across the walls and adsorption on the walls of the bag affect the choice of materials for a given compound and the time that the sample can be kept. Bags are made of different polymeric materials and are available in different volumes. Samples are collected in 2 -litre or 5 -litre 5 -ply aluminized bags. However, due to the diffusion or stability of some reactive gases, this type of sampling bag is not recommended mainly for hydrogen sulfide (H 2 S), sulfur dioxide (SO 2 ) and nitrogen dioxide (NO 2 ).

