
1 of 52 chapter: 9 > >


- Размер: 1.3 Mегабайта
- Количество слайдов: 51
Описание презентации 1 of 52 chapter: 9 > > по слайдам
1 of 52 chapter: 9 > > Krugman/Wells © 2009 Worth Publishers. Long-run Economic Growth
2 of 52 WHAT YOU WILL LEARN IN THIS CHAPTER How long-run growth can be measured by the increase in real GDP per capita, how this measure has changed over time, and how it varies across countries Why productivity is the key to long-run growth, and how productivity is driven by physical capital, human capital, and technological progress The factors that explain why growth rates differ so much among countries
3 of 52 WHAT YOU WILL LEARN IN THIS CHAPTER How growth has varied among several important regions of the world and why the convergence hypothesis applies to economically advanced countries The question of sustainability and the challenges to growth posed by scarcity of natural resources and environmental degradation
4 of 52 Comparing Economies Across Time and Space Real GDP per capita (log scale) $100, 000 1, 000 1907 1920 1930 1940 1950 1960 1970 1980 1990 2000 2007 Year
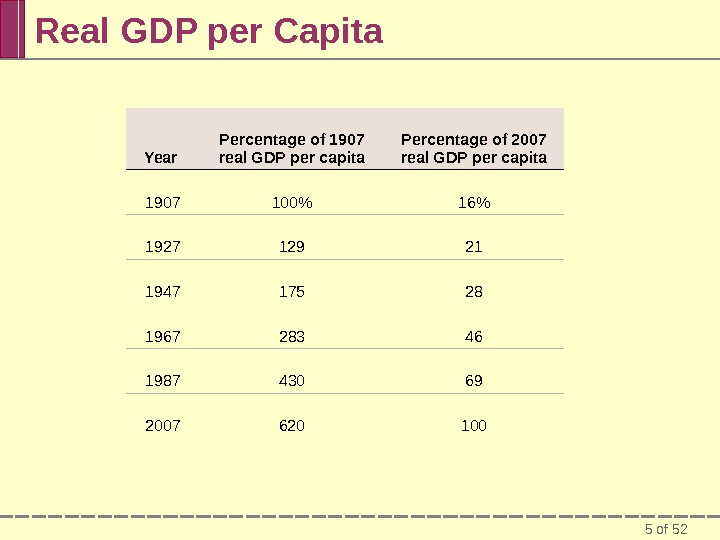
5 of 52 Real GDP per Capita Year Percentage of 1907 real GDP per capita Percentage of 2007 real GDP per capita 1907 100% 16%
6 of 52 Income Around the World,
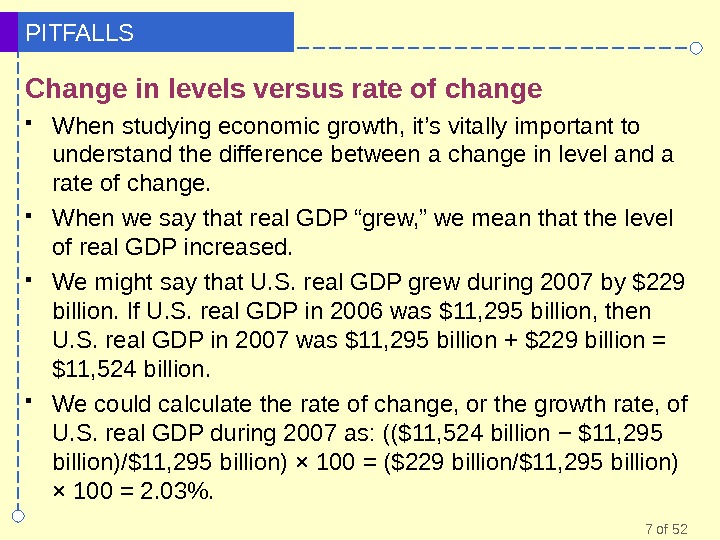
7 of 52 PITFALLS Change in levels versus rate of change When studying economic growth, it’s vitally important to understand the difference between a change in level and a rate of change. When we say that real GDP “grew, ” we mean that the level of real GDP increased. We might say that U. S. real GDP grew during 2007 by $229 billion. If U. S. real GDP in 2006 was $11, 295 billion, then U. S. real GDP in 2007 was $11, 295 billion + $229 billion = $11, 524 billion. We could calculate the rate of change, or the growth rate, of U. S. real GDP during 2007 as: (($11, 524 billion − $11, 295 billion)/$11, 295 billion) × 100 = ($229 billion/$11, 295 billion) × 100 = 2. 03%.
8 of 52 Growth Rates How did the United States manage to produce over six times more person in 2007 than in 1907? A little bit at a time. Long-run economic growth is normally a gradual process, in which real GDP per capita grows at most a few percent per year. From 1907 to 2007, real GDP per capita in the United States increased an average of 1. 8% each year.
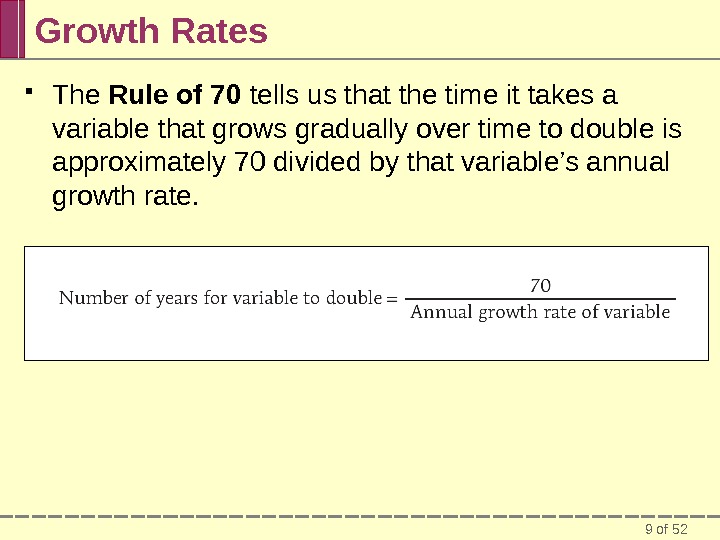
9 of 52 Growth Rates The Rule of 70 tells us that the time it takes a variable that grows gradually over time to double is approximately 70 divided by that variable’s annual growth rate.
10 of 52 Growth Rates United States 10% 8 6 4 2 0 -2 Average annual growth rate of real GDP per capita, 1980 -2007 Ireland Argentina. France 4. 1% 2. 0% 1. 5% 0. 8% -1. 4%8. 7% China India Zimbabwe 4. 1%
11 of 52► ECONOMICS IN ACTION India Takes Off India achieved independence from Great Britain in 1947, becoming the world’s most populous democracy—a status it has maintained to this day. Despite ambitious economic development plans, India’s performance was consistently sluggish. In 1980, India’s real GDP per capita was only about 50% higher than it had been in 1947. Real GDP per capita has grown at an average rate of 4. 1% a year, tripling between 1980 and 2007. What went right in India after 1980? Many economists point to policy reforms. For decades after independence, India had a tightly controlled, highly regulated economy. Today, things are very different: a series of reforms opened the economy to international trade and freed up domestic competition.
12 of 52► ECONOMICS IN ACTION The Luck of the Irish In the nineteenth century, Ireland was desperately poor. Even as late as the 1970 s, Ireland remained one of the poorest countries in Western Europe, poorer than Latin American countries such as Argentina and Venezuela. But for the last few decades real GDP per capita has grown almost as fast in Ireland as in China, and all that growth has made Ireland richer than most of Europe: Irish real GDP per capita is now higher than in the United Kingdom, France, and Germany. Why has Ireland, after centuries of poverty, done so well? A very good infrastructure and human capital.
13 of 52 The Sources of Long-Run Growth Labor productivity, often referred to simply as productivity, is output per worker. Physical capital consists of human-made resources such as buildings and machines. Human capital is the improvement in labor created by the education and knowledge embodied in the workforce. Technology is the technical means for the production of goods and services.
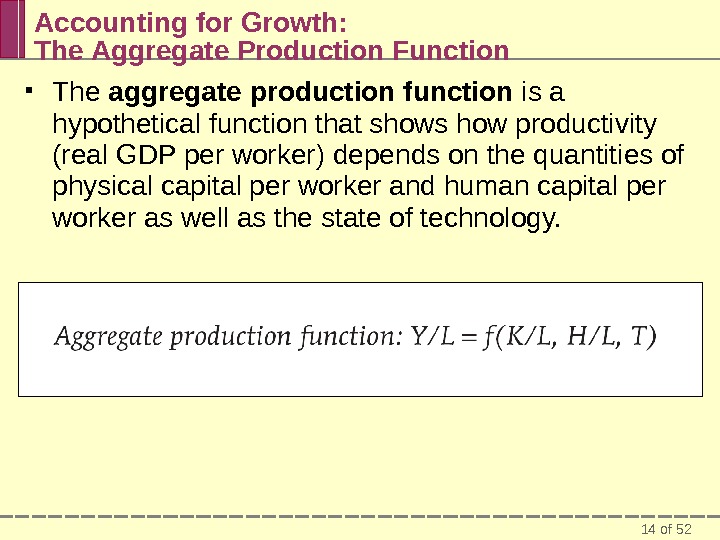
14 of 52 Accounting for Growth: The Aggregate Production Function The aggregate production function is a hypothetical function that shows how productivity (real GDP per worker) depends on the quantities of physical capital per worker and human capital per worker as well as the state of technology.
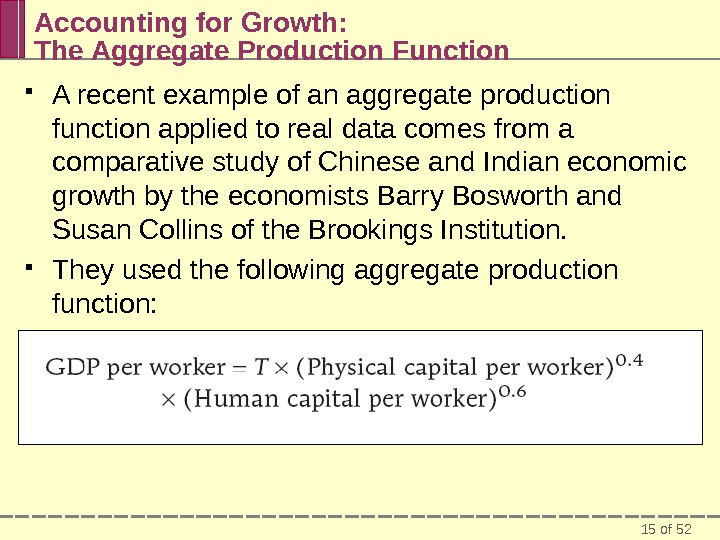
15 of 52 Accounting for Growth: The Aggregate Production Function A recent example of an aggregate production function applied to real data comes from a comparative study of Chinese and Indian economic growth by the economists Barry Bosworth and Susan Collins of the Brookings Institution. They used the following aggregate production function:
16 of 52 Accounting for Growth: The Aggregate Production Function Using this function, they tried to explain why China grew faster than India between 1978 and 2004. About half the difference, they found, was due to China’s higher levels of investment spending, which raised its level of physical capital per worker faster than India’s. The other half was due to faster Chinese technological progress.
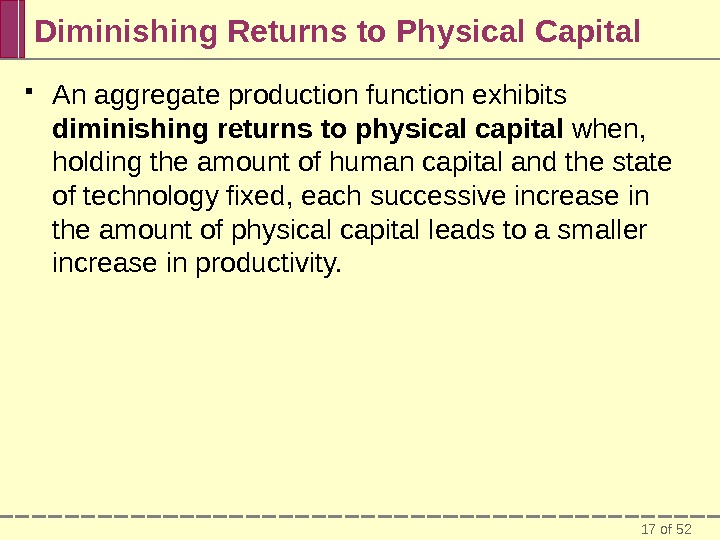
17 of 52 Diminishing Returns to Physical Capital An aggregate production function exhibits diminishing returns to physical capital when, holding the amount of human capital and the state of technology fixed, each successive increase in the amount of physical capital leads to a smaller increase in productivity.
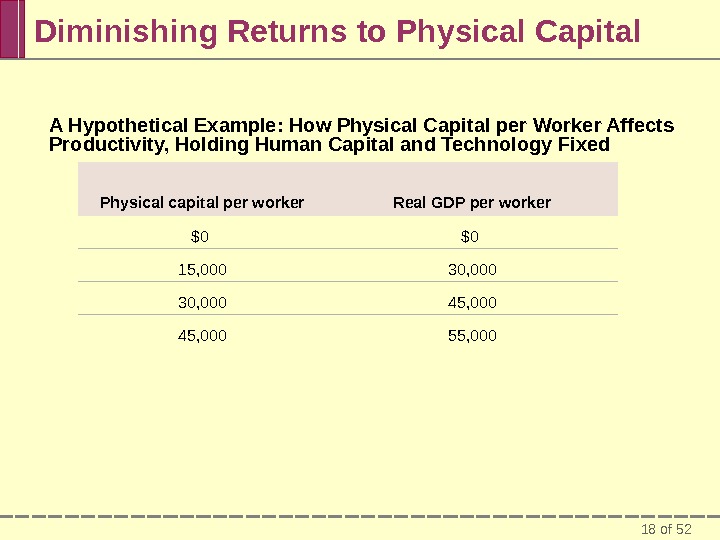
18 of 52 Diminishing Returns to Physical Capital Physical capital per worker Real GDP per worker $0 $0 15, 000 30, 000 45, 000 55, 000 A Hypothetical Example: How Physical Capital per Worker Affects Productivity, Holding Human Capital and Technology Fixed
20 of 52 FOR INQUIRING MINDS The Wal-Mart Effect After 20 years of being sluggish, U. S. productivity growth accelerated sharply (grew at a much faster rate) in the late 1990 s. What caused that acceleration? Was it the rise of the Internet? According to Mc. Kinsey, the major source of productivity improvement after 1995 was a surge in output per worker in retailing—stores were selling much more merchandise per worker. Why? Well Wal-Mart has been a pioneer in using modern technology (for example, computers) to improve productivity. A lot of economic growth comes from everyday improvements rather than glamorous new technologies.
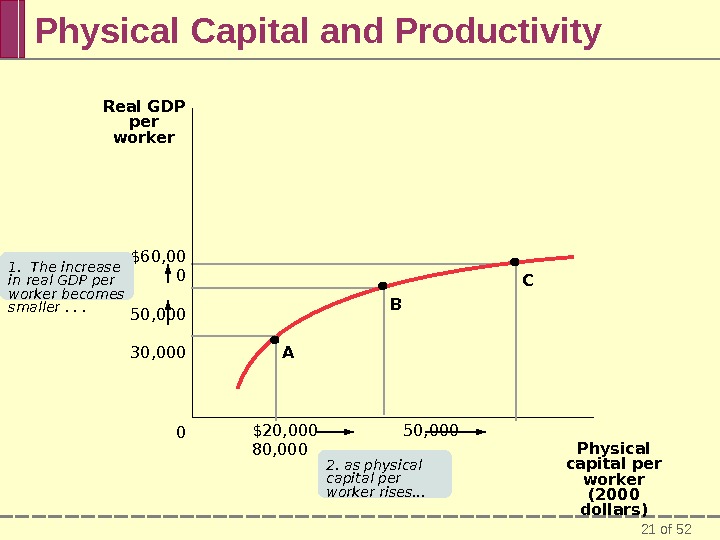
21 of 52 Physical Capital and Productivity $60, 00 0 50, 000 30, 000 0 Real GDP per worker $20, 000 50, 000 80, 000 Physical capital per worker (2000 dollars)1. The increase in real GDP per worker becomes smaller. . . 2. as physical capital per worker rises…
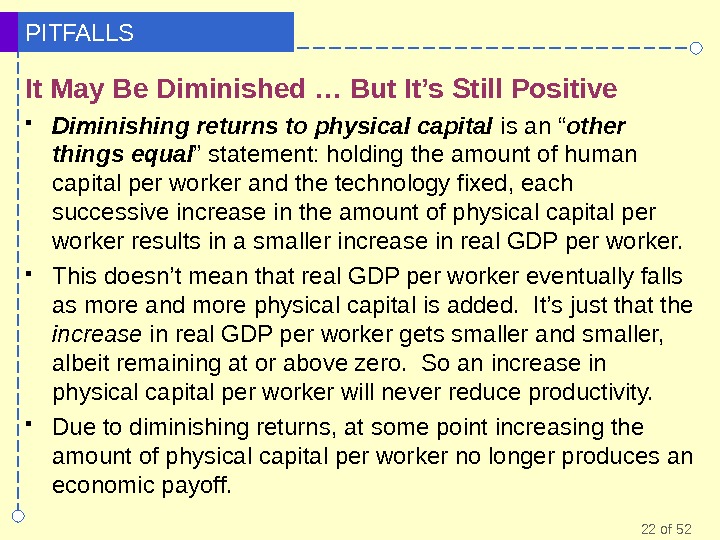
22 of 52 PITFALLS It May Be Diminished … But It’s Still Positive Diminishing returns to physical capital is an “ other things equal ” statement: holding the amount of human capital per worker and the technology fixed, each successive increase in the amount of physical capital per worker results in a smaller increase in real GDP per worker. This doesn’t mean that real GDP per worker eventually falls as more and more physical capital is added. It’s just that the increase in real GDP per worker gets smaller and smaller, albeit remaining at or above zero. So an increase in physical capital per worker will never reduce productivity. Due to diminishing returns, at some point increasing the amount of physical capital per worker no longer produces an economic payoff.
23 of 52 Growth Accounting Growth accounting estimates the contribution of each major factor in the aggregate production function to economic growth. The amount of physical capital per worker grows 3% a year. According to estimates of the aggregate production function, each 1% rise in physical capital per worker, holding human capital and technology constant, raises output per worker by 1⁄3 of 1%, or 0. 33%. Total factor productivity is the amount of output that can be achieved with a given amount of factor inputs.
24 of 52 Technological Progress and Productivity Growth $120, 000 90, 000 60, 000 30, 000 0 Real GDP per worker (2000 dollars) $20, 000 50, 000 80, 000 100, 000 Physical capital per worker (2000 dollars)Rising total factor productivity shifts curve up
25 of 52 What about Natural Resources? In contrast to earlier times, in the modern world, natural resources are a much less important determinant of productivity than human or physical capital for the great majority of countries. For example, some nations with very high real GDP per capita, such as Japan, have very few natural resources. Some resource-rich nations, such as Nigeria (which has sizable oil deposits), are very poor.
26 of 52► ECONOMICS IN ACTION The Information Technology Paradox Many economists were puzzled by the slowdown in the U. S. growth rate of labor productivity—a fall from an average annual growth rate of 3% in the late 1960 s to slightly less than 1% in the mid-1980 s. This was surprising given that there appeared to be rapid progress in technology. Why didn’t information technology show large rewards?
27 of 52► ECONOMICS IN ACTION The Information Technology Paradox MIT economics professor and Nobel laureate Robert Solow, a pioneer in the analysis of economic growth, declared that the information technology revolution could be seen everywhere except in the economic statistics. Paul David suggested that a new technology doesn’t yield its full potential if you use it in old ways. Productivity would take off when people really changed their way of doing business to take advantage of the new technology—such as, replacing letters and phone calls with electronic communications. Sure enough, productivity growth accelerated dramatically in the second half of the 1990…
28 of 52 Why Growth Rates Differ A number of factors influence differences among countries in their growth rates. These are government policies and institutions that alter: savings and investment spending. foreign investment. education. Infrastructure. research and development. political stability. the protection of property rights.
29 of 52 Why Growth Rates Differ Latin America East Asia 1960 2000 Percentage of population with no schooling 37. 90% 14. 60% 52. 50% 19. 80% Percentage of population with high school or above 5. 9 19. 5 4. 4 26. 5 Human Capital in Latin America and East Asia
30 of 52 FOR INQUIRING MINDS Inventing R&D Thomas Edison is best known as the inventor of the light bulb and the phonograph. But his biggest invention was “research and development”!!! In 1875 Edison created something new: his Menlo Park, New Jersey, laboratory employed 25 men full-time to generate new products and processes for business. ( http: //www. edisonnj. org/menlopark/ ) In other words, he did not set out to pursue a particular idea and then cash in. He created an organization whose purpose was to create new ideas year after year. Research and development , or R&D , is spending to create and implement new technologies.
31 of 52 The Role of Government in Promoting Economic Growth Political stability and protection of property rights are crucial ingredients in long-run economic growth. Even when governments aren’t corrupt, excessive government intervention can be a brake on economic growth. If large parts of the economy are supported by government subsidies, protected from imports, or otherwise insulated from competition, productivity tends to suffer because of a lack of incentives.
32 of 52 The Role of Government in Promoting Economic Growth
33 of 52► ECONOMICS IN ACTION The Brazilian Breadbasket In recent years, Brazil’s economy has made a strong showing, especially in agriculture. This success depends on exploiting a natural resource, the tropical savannah land known as the cerrado. A combination of three factors changed this land into a useable resource: technological progress due to research and development improved economic policies addition of physical capital Brazil has already overtaken the United States as the world’s largest beef exporter and may not be far behind in soybeans.
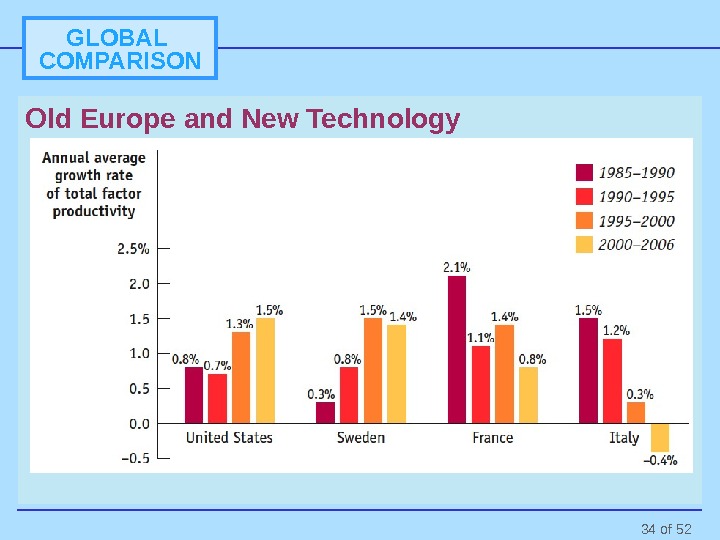
34 of 52 GLOBAL COMPARISON Old Europe and New Technology
35 of 52 Success, Disappointment, and Failure Real GDP per capita (log scale) 1960 1970 1980 1990 2000 2007 Year$100, 000 1,
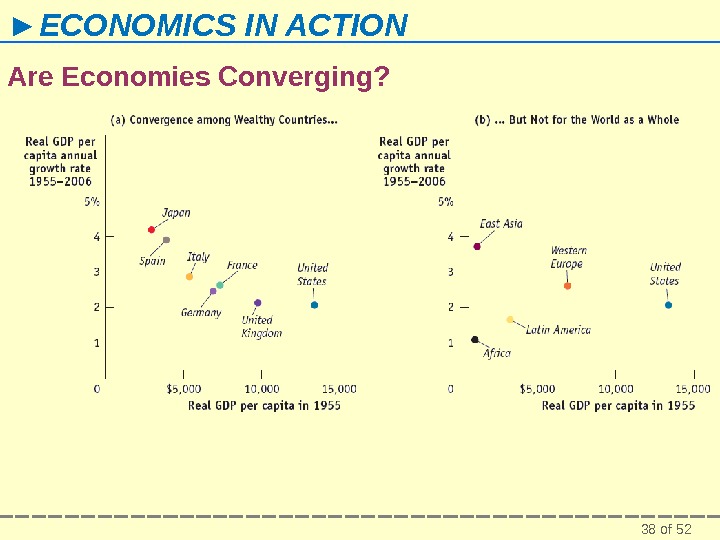
36 of 52 Success, Disappointment, and Failure The world economy contains examples of success and failure in the effort to achieve long-run economic growth. East Asian economies have done many things right and achieved very high growth rates. In Latin America , where some important conditions are lacking, growth has generally been disappointing. In Africa , real GDP per capita has declined for several decades, although there are some signs of progress now.
37 of 52 Success, Disappointment, and Failure The growth rates of economically advanced countries have converged, but not the growth rates of countries across the world. This has led economists to believe that the convergence hypothesis fits the data only when factors that affect growth, such as education, infrastructure, and favorable policies and institutions, are held equal across countries.
38 of 52► ECONOMICS IN ACTION Are Economies Converging?
39 of 52 Success, Disappointment, and Failure East Asia ’s spectacular growth was generated by high savings and investment spending rates, emphasis on education, and adoption of technological advances from other countries. Poor education, political instability, and irresponsible government policies are major factors in the slow growth of Latin America. In sub-Saharan Africa , severe instability, war, and poor infrastructure— particularly affecting public health—have resulted in a catastrophic failure of growth. Encouragingly, the economic performance since the mid-1990 s has been much better than in preceding years.
40 of 52 Is World Growth Sustainable? Long-run economic growth is sustainable if it can continue in the face of the limited supply of natural resources and the impact of growth on the environment. Differing views about the impact of limited natural resources on long-run economic growth turn on the answers to three questions: How large are the supplies of key natural resources? How effective will technology be at finding alternatives to natural resources? Can long-run economic growth continue in the face of resource scarcity?
41 of 52 The Real Price of Oil, 1949 -2007 Real domestic U. S. oil price (2000 dollars, per barrel) 1949 1960 1970 1980 1990 2000 2007 Year$
42 of 52 U. S. Oil Consumption and Growth over Time Oil consumption (thousands of barrels per day) 1949 1960 1970 1980 1990 2000 2007 Year 25, 000 20, 000 15, 000 10, 000 5, 000 Real GDP per capita (2000 dollars) $40, 000 30, 000 20, 000 10,
43 of 52 Economic Growth and the Environment The limits to growth arising from environmental degradation are more difficult to overcome because overcoming them requires effective government intervention. The emission of greenhouse gases is clearly linked to growth, and limiting them will require some reduction in growth. However, the best available estimates suggest that a large reduction in emissions would require only a modest reduction in the growth rate.
44 of 52 Climate Change and Growth Carbon dioxide emissions (million metric tons) 1980 1985 1990 1995 2000 2005 Year 7, 000 6, 000 5, 000 4, 000 3, 000 2, 000 1,
45 of 52 Economic Growth and the Environment There is broad consensus that government action to address climate change and greenhouse gases should be in the form of market-based incentives, like a carbon tax or a cap and trade system. It will also require rich and poor countries to come to some agreement on how the cost of emissions reductions will be shared.
46 of 52 SUMMARY 1. Growth is measured as changes in real GDP per capita in order to eliminate the effects of changes in the price level and changes in population size. Levels of real GDP per capita vary greatly around the world: more than half of the world’s population lives in countries that are still poorer than the United States was in 1907. Over the course of the twentieth century, real GDP per capita in the United States increased fivefold. 2. Growth rates of real GDP per capita also vary widely. According to the Rule of 70, the number of years it takes for real GDP per capita to double is equal to 70 divided by the annual growth rate of real GDP per capita.
47 of 52 SUMMARY 3. The key to long-run economic growth is rising labor productivity, or just productivity, which is output per worker. Increases in productivity arise from increases in physical capital per worker and human capital per worker as well as advances in technology. The aggregate production function shows how real GDP per worker depends on these three factors. Other things equal, there are diminishing returns to physical capital: holding human capital per worker and technology fixed, each successive addition to physical capital per worker yields a smaller increase in productivity than the one before. Growth accounting, which estimates the contribution of each factor to a country’s economic growth, has shown that rising total factor productivity is key to long-run growth. It is usually interpreted as the effect of technological progress.
48 of 52 SUMMARY 4. The large differences in countries’ growth rates are largely due to differences in their rates of accumulation of physical and human capital as well as differences in technological progress. A prime factor is differences in savings and investment rates. Technological progress is largely a result of research and development, or R&D. 5. Government actions that help growth are the building of infrastructure, particularly for public health, the creation and regulation of a well-functioning banking system that channels savings and investment spending, and the financing of both education and R&D. Government actions that retard growth are political instability, the neglect or violation of property rights, corruption, and excessive government intervention.
49 of 52 SUMMARY 6. The world economy contains examples of success and failure in the effort to achieve long-run economic growth. East Asian economies have done many things right and achieved very high growth rates. In Latin America, where some important conditions are lacking, growth has generally been disappointing. In Africa, real GDP per capita has declined for several decades, although there are recent signs of progress. The growth rates of economically advanced countries have converged, but not the growth rates of countries across the world. This has led economists to believe that the convergence hypothesis fits the data only when factors that affect growth, such as education, infrastructure, and favorable policies and institutions, are held equal across countries.
50 of 52 SUMMARY 7. Economists generally believe that environmental degradation poses a greater problem for whether long-run economic growth is sustainable than natural resource scarcity. Addressing environmental degradation requires effective governmental intervention, but the problem of natural resource scarcity is often well handled by the market price response. 8. The emission of greenhouse gases is clearly linked to growth, and limiting them will require some reduction in growth. However, the best available estimates suggest that a large reduction in emissions would require only a modest reduction in the growth rate.
51 of 52 SUMMARY 9. There is broad consensus that government action to address climate change and greenhouse gases should be in the form of market-based incentives, like a carbon tax or a cap and trade system. It will also require rich and poor countries to come to some agreement on.
52 of 52 The End of Chapter 9 coming attraction: Chapter 10: Savings, Investment Spending, and the Financial System