
1 of 37 chapter: 7 > >


- Размер: 1017.5 Кб
- Количество слайдов: 37
Описание презентации 1 of 37 chapter: 7 > > по слайдам
1 of 37 chapter: 7 > > Krugman/Wells © 2009 Worth Publishers. Tracking the Macroeconomy
2 of 37 WHAT YOU WILL LEARN IN THIS CHAPTER How economists use aggregate measures to track the performance of the economy. What gross domestic product , or GDP , is and the three ways of calculating it. The difference between real GDP and nominal GDP and why real GDP is the appropriate measure of real economic activity. What a price index is and how it is used to calculate the inflation rate.
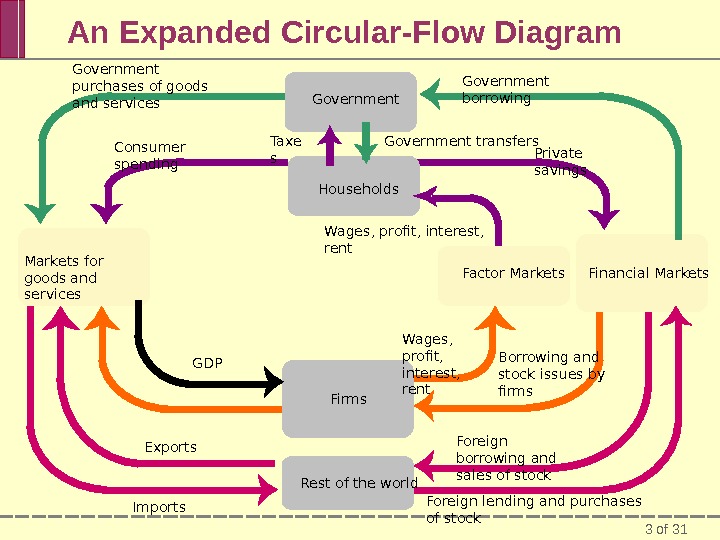
3 of 31 An Expanded Circular-Flow Diagram Government Firms. Markets for goods and services Financial Markets. Households Factor Markets Rest of the world. Government purchases of goods and services Government borrowing Private savings. Government transfers Wages, profit, interest, rent Wages, profit, interest, rent Borrowing and stock issues by firms Foreign borrowing and sales of stock Foreign lending and purchases of stock. Exports Imports GDP Taxe s. Consumer spending
4 of 37 The National Accounts Almost all countries calculate a set of numbers known as the national income and product accounts. The national income and product accounts, or national accounts, keep track of the flows of money between different parts of the economy.
5 of 37 The National Accounts Households earn income via the factor markets from wages , interest on bonds , dividends on stocks , and rent on land. A stock is a share in the ownership of a company held by a shareholder. A bond is borrowing in the form of an IOU that pays interest. In addition, households receive government transfers from the government. Disposable income , total household income minus taxes, is available to spend on consumption or to save.
6 of 37 The National Accounts Private savings , equal to disposable income minus consumer spending, is disposable income that is not spent on consumption. The banking, stock, and bond markets, which channel private savings and foreign lending into investment spending, government borrowing, and foreign borrowing, are known as the financial markets.
7 of 37 The National Accounts Government purchases of goods and services (G) is paid for by tax receipts as well as by government borrowing. Exports (X) generate an inflow of funds into the country from the rest of the world, while imports (IM) lead to an outflow of funds to the rest of the world.
8 of 37 The National Accounts Inventories are stocks of goods and raw materials held to facilitate business operations. Investment spending is spending on productive physical capital, such as machinery and construction of structures, and on changes to inventories. Final goods and services are goods and services sold to the final, or end, user. Intermediate goods and services are goods and services—bought from one firm by another firm— that are inputs for production of final goods and services.
9 of 37 Gross Domestic Product Gross domestic product or GDP measures the total value of all final goods and services produced in the economy during a given year. It does not include the value of intermediate goods. Aggregate spending , the sum of consumer spending, investment spending government purchases of goods an services, and exports minus imports, I the total spending on domestically produce final goods and services in the economy.
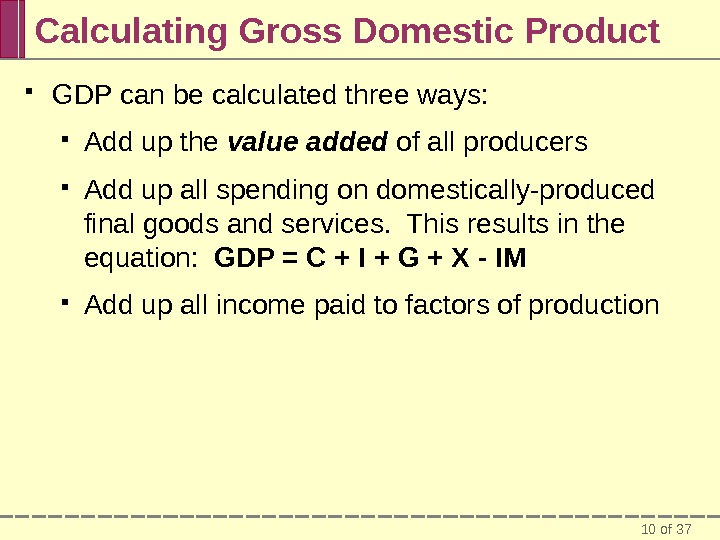
10 of 37 Calculating Gross Domestic Product GDP can be calculated three ways: Add up the value added of all producers Add up all spending on domestically-produced final goods and services. This results in the equation: GDP = C + I + G + X — IM Add up all income paid to factors of production
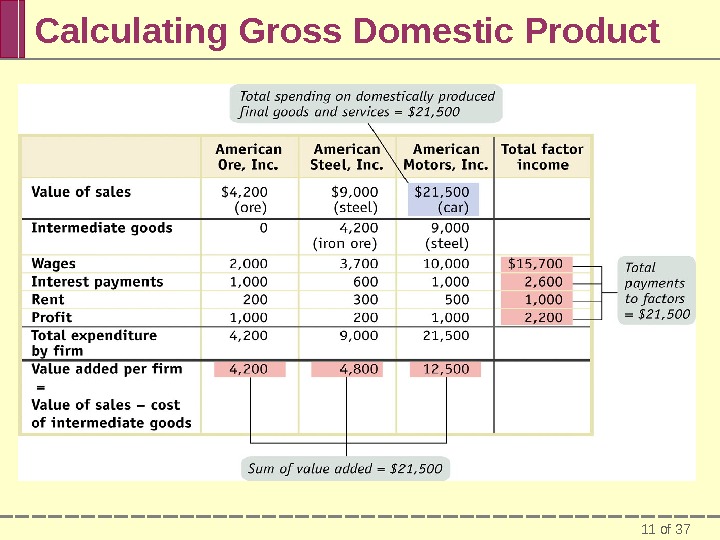
11 of 37 Calculating Gross Domestic Product
12 of 37 FOR INQUIRING MINDS Our Imputed Lives Some economists have produced alternative measures that try to “impute” the value of household. But the standard measure of GDP doesn’t contain that imputation. GDP estimates do, however, include an imputation for the value of “owner-occupied housing. ” If you buy the home you were formerly renting, GDP does not go down. Statisticians make an estimate of what you would have paid if you rented whatever you live in, whether it’s an apartment or a house. To be accurate, estimates of GDP must take into account the value of housing that is occupied by owners as well as the value of rental housing.
13 of 37 PITFALLS GDP: What’s In and What’s Out Included domestically produced final goods and services (including capital goods) new construction of structures changes to inventories Not Included intermediate goods and services inputs used goods financial assets like stocks and bonds foreign-produced goods and services
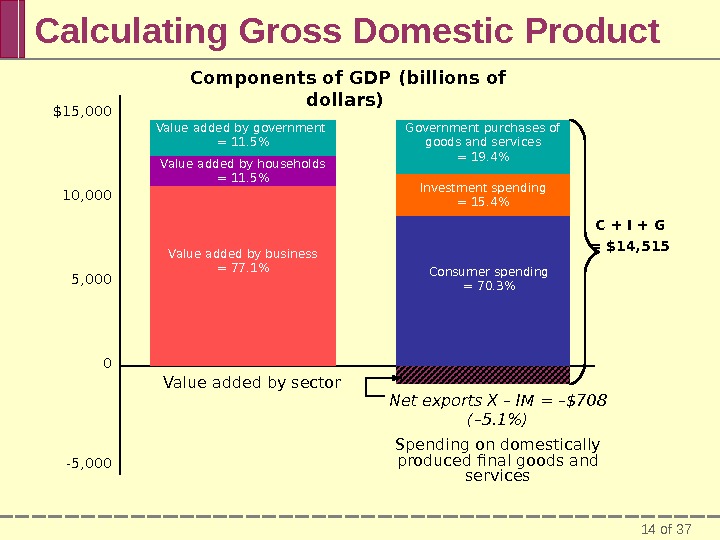
14 of 37 Calculating Gross Domestic Product $15, 000 10, 000 5, 000 0 -5, 000 Value added by government = 11. 5% Value added by households = 11. 5% Value added by business = 77. 1% Consumer spending = 70. 3%Investment spending = 15. 4%Government purchases of goods and services = 19. 4%Components of GDP (billions of dollars) C + I + G = $14, 515 Net exports X – IM = –$708 (– 5. 1%) Spending on domestically produced final goods and services. Value added by sector
15 of 37► ECONOMICS IN ACTION Creating the National Accounts The national accounts owe their creation to the Great Depression. All government officials had were scattered statistics: railroad freight car loadings, stock prices, and incomplete indexes of industrial production. Simon Kuznets developed a set of national income accounts. The first version of these accounts was presented to Congress in 1937 and in a research report titled National Income. The push to complete the national accounts came during World War II, when policy makers were in even more need of comprehensive measures of the economy’s performance. The federal government began issuing estimates of gross domestic product and gross national product in 1942.
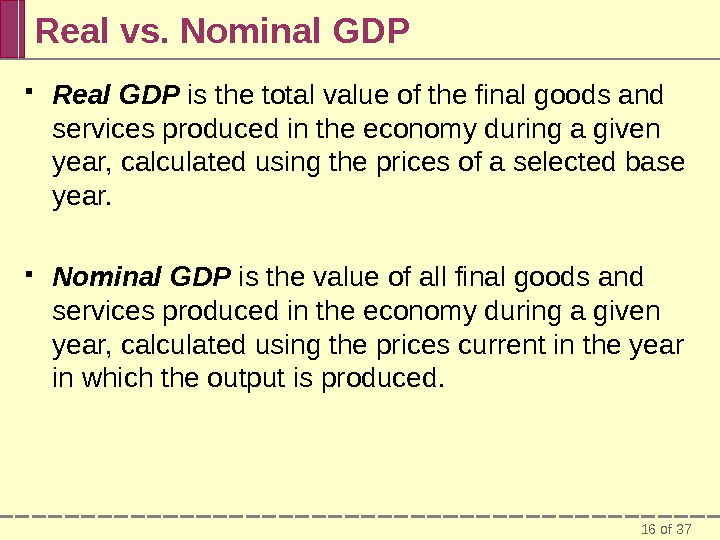
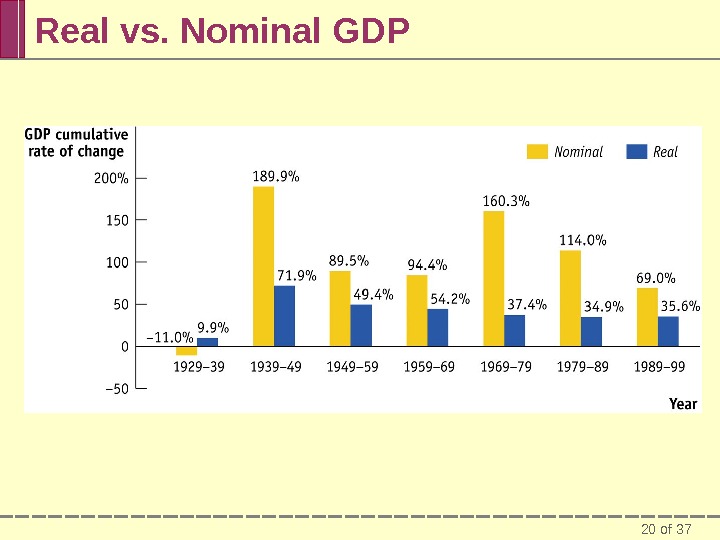
16 of 37 Real vs. Nominal GDP Real GDP is the total value of the final goods and services produced in the economy during a given year, calculated using the prices of a selected base year. Nominal GDP is the value of all final goods and services produced in the economy during a given year, calculated using the prices current in the year in which the output is produced.
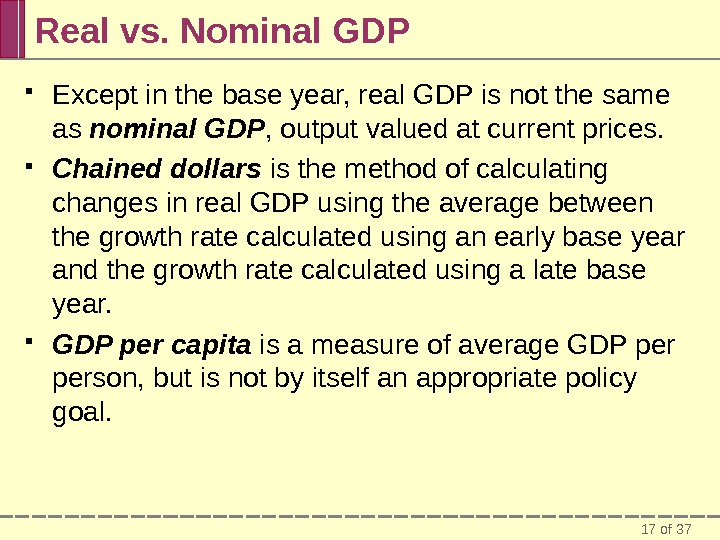
17 of 37 Real vs. Nominal GDP Except in the base year, real GDP is not the same as nominal GDP , output valued at current prices. Chained dollars is the method of calculating changes in real GDP using the average between the growth rate calculated using an early base year and the growth rate calculated using a late base year. GDP per capita is a measure of average GDP person, but is not by itself an appropriate policy goal.
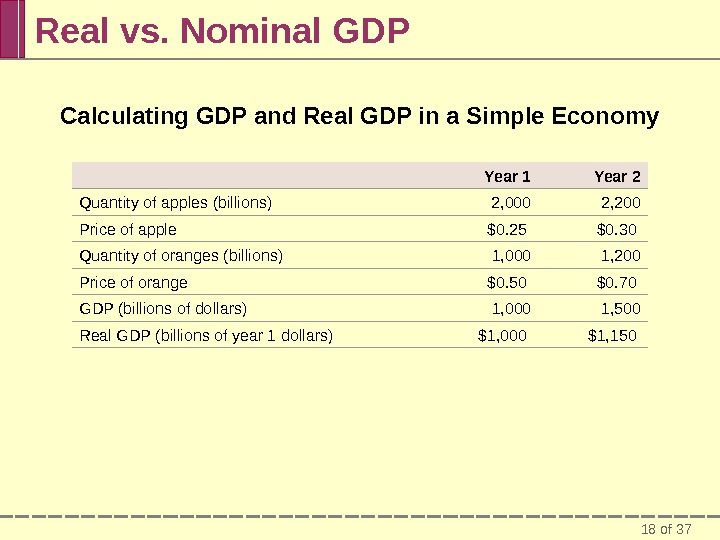
18 of 37 Real vs. Nominal GDP Calculating GDP and Real GDP in a Simple Economy Year 1 Year 2 Quantity of apples (billions) 2, 000 2, 200 Price of apple $0. 25 $0. 30 Quantity of oranges (billions) 1, 000 1, 200 Price of orange $0. 50 $0. 70 GDP (billions of dollars) 1, 000 1, 500 Real GDP (billions of year 1 dollars) $1, 000 $1,
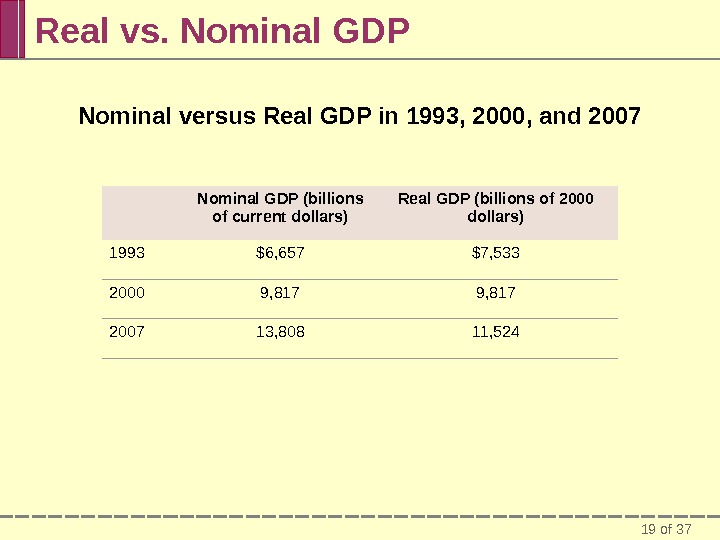
19 of 37 Real vs. Nominal GDP Nominal versus Real GDP in 1993, 2000, and 2007 Nominal GDP (billions of current dollars) Real GDP (billions of 2000 dollars) 1993 $6, 657 $7, 533 2000 9, 817 2007 13, 808 11,
20 of 37 Real vs. Nominal GDP
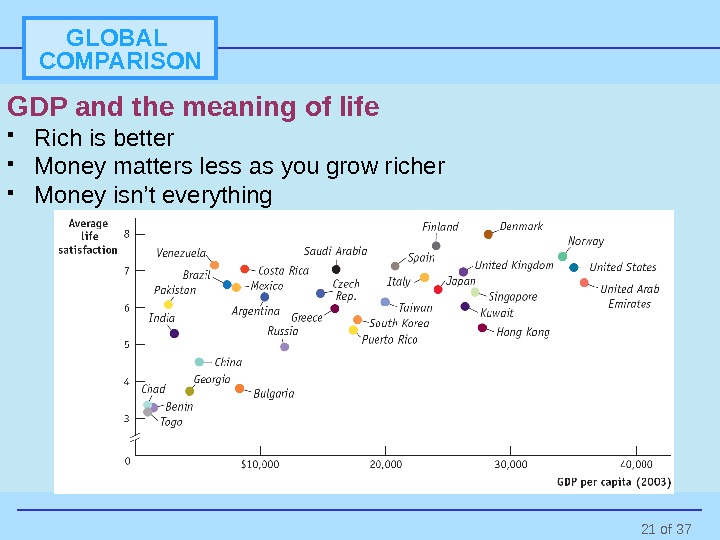
21 of 37 GLOBAL COMPARISON GDP and the meaning of life Rich is better Money matters less as you grow richer Money isn’t everything
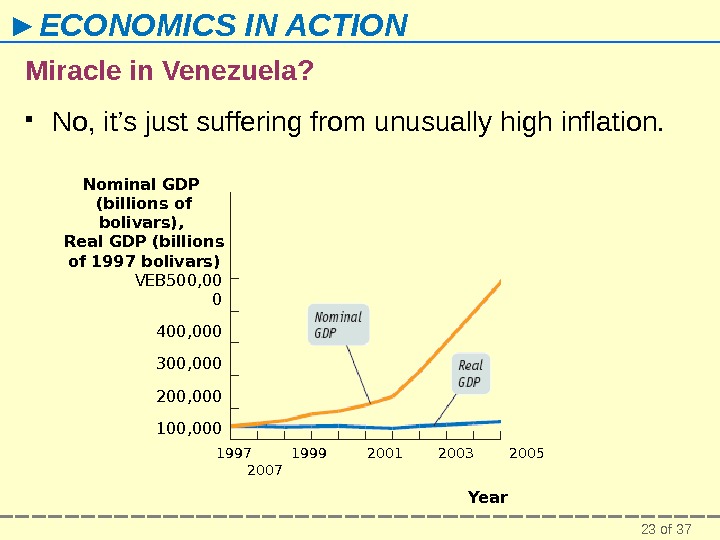
22 of 37► ECONOMICS IN ACTION Miracle in Venezuela? The South American nation of Venezuela has a distinction that may surprise you: in recent years, it has had one of the world’s fastest-growing nominal GDPs. Between 1997 and 2007, Venezuelan nominal GDP grew by an average of 28% each year—much faster than nominal GDP in the United States or even in booming economies like China. So is Venezuela experiencing an economic miracle?
23 of 37► ECONOMICS IN ACTION Miracle in Venezuela? No, it’s just suffering from unusually high inflation. Nominal GDP (billions of bolivars), Real GDP (billions of 1997 bolivars) 1997 1999 2001 2003 2005 2007 Year. VEB 500, 00 0 400, 000 300, 000 200, 000 100,
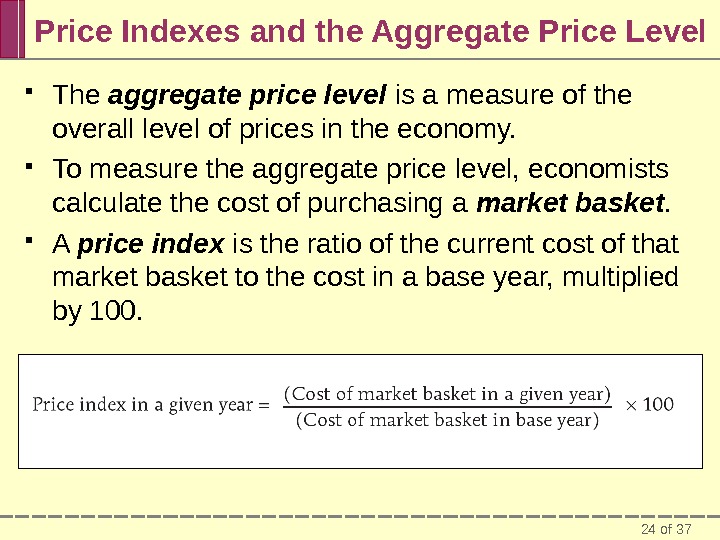
24 of 37 Price Indexes and the Aggregate Price Level The aggregate price level is a measure of the overall level of prices in the economy. To measure the aggregate price level, economists calculate the cost of purchasing a market basket. A price index is the ratio of the current cost of that market basket to the cost in a base year, multiplied by 100.
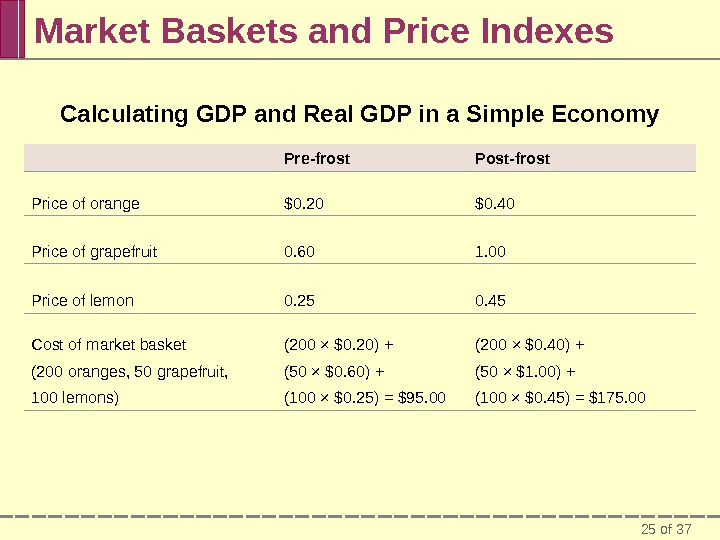
25 of 37 Market Baskets and Price Indexes Pre-frost Post-frost Price of orange $0. 20 $0. 40 Price of grapefruit 0. 60 1. 00 Price of lemon 0. 25 0. 45 Cost of market basket (200 × $0. 20) + (200 × $0. 40) + (200 oranges, 50 grapefruit, (50 × $0. 60) + (50 × $1. 00) + 100 lemons) (100 × $0. 25) = $95. 00 (100 × $0. 45) = $175. 00 Calculating GDP and Real GDP in a Simple Economy
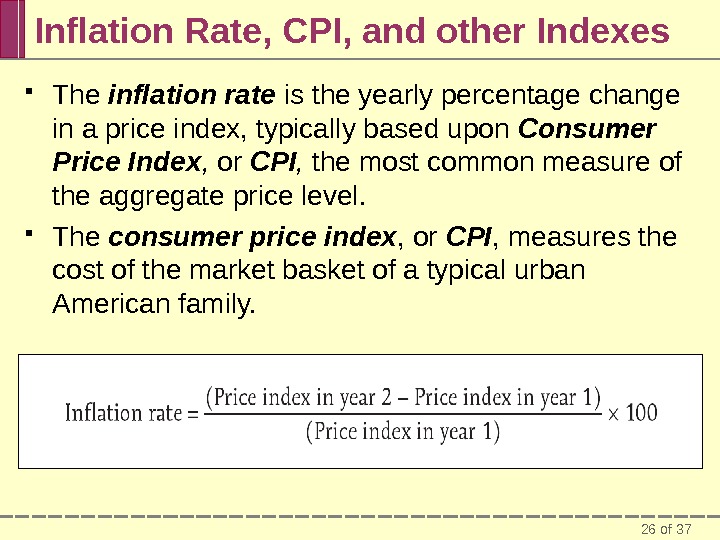
26 of 37 Inflation Rate, CPI, and other Indexes The inflation rate is the yearly percentage change in a price index, typically based upon Consumer Price Index , or CPI , the most common measure of the aggregate price level. The consumer price index , or CPI , measures the cost of the market basket of a typical urban American family.
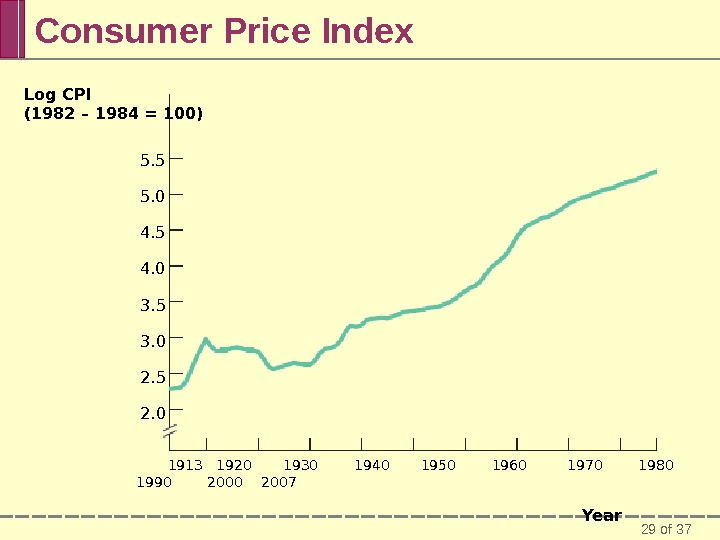
27 of 37 Consumer Price Index
28 of 37 FOR INQUIRING MINDS Is the CPI biased? The U. S. government takes considerable care in measuring consumer prices. Nonetheless, many economists believe that the consumer price index systematically overstates the actual rate of inflation. One reason is the fact that the CPI measures the cost of buying a given market basket. Yet, consumers typically alter the mix of goods and services they buy, reducing purchases of products that have become relatively more expensive and increasing purchases of products that have become relatively cheaper. The second reason arises from innovation. By widening the range of consumer choice, innovation makes a given amount of money worth more.
29 of 37 Consumer Price Index Log CPI (1982 – 1984 = 100) 5. 5 5. 0 4. 5 4. 0 3. 5 3. 0 2. 5 2. 0 1913 1920 1930 1940 1950 1960 1970 1980 1990 2007 Year
30 of 37 Other Price Measures A similar index to CPI for goods purchased by firms is the producer price index. Economists also use the GDP deflator , which measures the price level by calculating the ratio of nominal to real GDP. The GDP deflator for a given year is 100 times the ratio of nominal GDP to real GDP in that year.
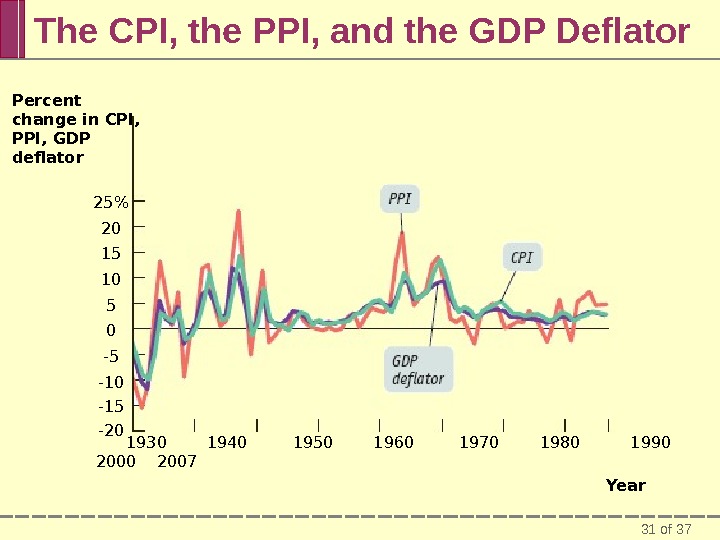
31 of 37 The CPI, the PPI, and the GDP Deflator Percent change in CPI, PPI, GDP deflator 25% 20 15 10 5 0 -5 -10 -15 -20 1930 1940 1950 1960 1970 1980 1990 2000 2007 Year
32 of 37► ECONOMICS IN ACTION Indexing to the CPI The CPI has a direct and immediate impact on millions of Americans. The reason is that many payments are tied, or “indexed, ” to the CPI—the amount paid rises or falls when the CPI rises or falls. Today, 48 million people receive checks from Social Security. The amount of an individual’s check is determined by a formula that reflects his or her previous payments into the system as well as other factors. In addition, all Social Security payments are adjusted each year to offset any increase in consumer prices over the previous year. The CPI is used to calculate the official estimate of the inflation rate used to adjust these payments yearly.
33 of 37 SUMMARY 1. Economists keep track of the flows of money between sectors with the national income and product accounts, or national accounts. Households earn income via the factor markets from wages. Disposable income is allocated to consumer spending ( C ) and private savings. Via the financial markets, private savings and foreign lending are channeled to investment spending ( I ), government borrowing, and foreign borrowing. Government purchases of goods and services ( G ) are paid for by tax revenues and any government borrowing. Exports ( X ) generate an inflow of funds into the country from the rest of the world, but imports ( IM ) lead to an outflow of funds to the rest of the world.
34 of 37 SUMMARY 2. Gross domestic product, or GDP, measures the value of all final goods and services produced in the economy. It does not include the value of intermediate goods and services, but it does include inventories and net exports ( X − IM ). It can be calculated in three ways: add up the value added by all producers; add up all spending on domestically produced final goods and services ( GDP = C + I + G + X − IM); or add up all the income paid by domestic firms to factors of production. These three methods are equivalent.
35 of 37 SUMMARY 3. Real GDP is the value of the final goods and services produced calculated using the prices of a selected base year. Except in the base year, real GDP is not the same as nominal GDP, the value of aggregate output calculated using current prices. Analysis of the growth rate of aggregate output must use real GDP. Real GDP per capita is a measure of average aggregate output person but is not in itself an appropriate policy goal. U. S. statistics on real GDP are always expressed in chained dollars.
36 of 37 SUMMARY 4. To measure the aggregate price level, economists calculate the cost of purchasing a market basket. A price index is the ratio of the current cost of that market basket to the cost in a selected base year, multiplied by 100. 5. The inflation rate is the yearly percent change in a price index, typically based on the consumer price index, or CPI, the most common measure of the aggregate price level. A similar index for goods and services purchased by firms is the producer price index, or PPI. Finally, economists also use the GDP deflator, which measures the price level by calculating the ratio of nominal to real GDP times 100.
37 of 37 The End of Chapter 7 coming attraction: Chapter 8: Unemployment and Inflation