
1 CHAPTER V GROWTH AND GROWTH POLICY


- Размер: 346 Кб
- Количество слайдов: 39
Описание презентации 1 CHAPTER V GROWTH AND GROWTH POLICY по слайдам
1 CHAPTER V GROWTH AND GROWTH POLICY
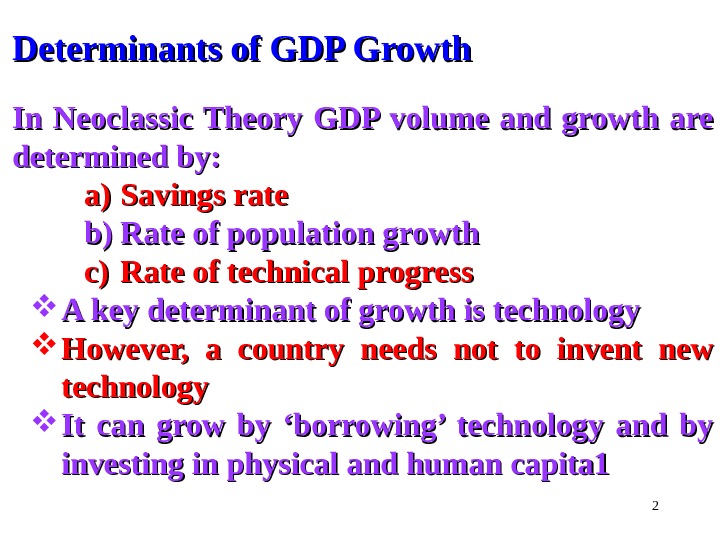
2 Determinants of GDP Growth In Neoclassic Theory GDP volume and growth are determined by: a)a) Savings rate b)b) Rate of population growth c)c) Rate of technical progress A key determinant of growth is technology However, a country needs not to invent new technology It can grow by ‘borrowing’ technology and by investing in physical and human capita
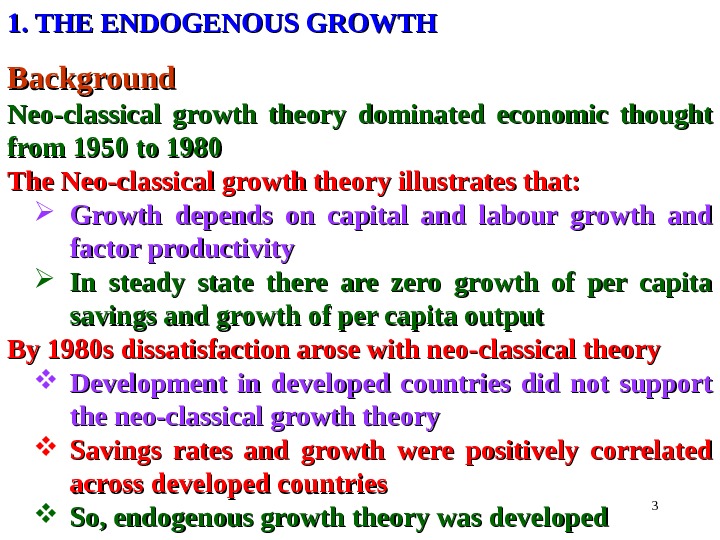
31. THE ENDOGENOUS GROWTH Background Neo-classical growth theory dominated economic thought from 1950 to 1980 The Neo-classical growth theory illustrates that: Growth depends on capital and labour growth and factor productivity In steady state there are zero growth of per capita savings and growth of per capita output By 1980 s dissatisfaction arose with neo-classical theory Development in developed countries did not support the neo-classical growth theory Savings rates and growth were positively correlated across developed countries So, endogenous growth theory was developed
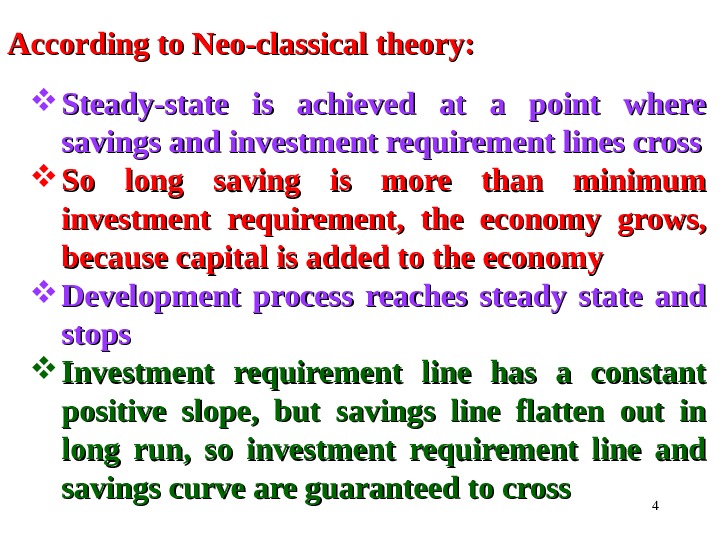
4 According to Neo-classical theory: Steady-state is achieved at a point where savings and investment requirement lines cross So long saving is more than minimum investment requirement, the economy grows, because capital is added to the economy Development process reaches steady state and stops Investment requirement line has a constant positive slope, but savings line flatten out in long run, so investment requirement line and savings curve are guaranteed to cross
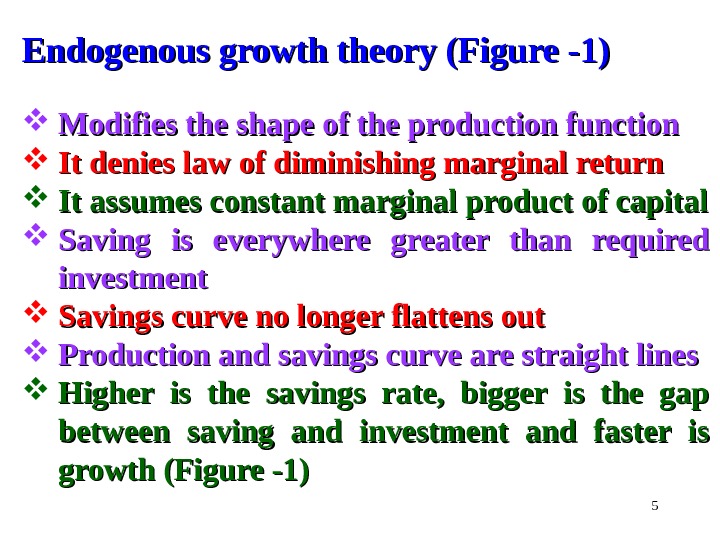
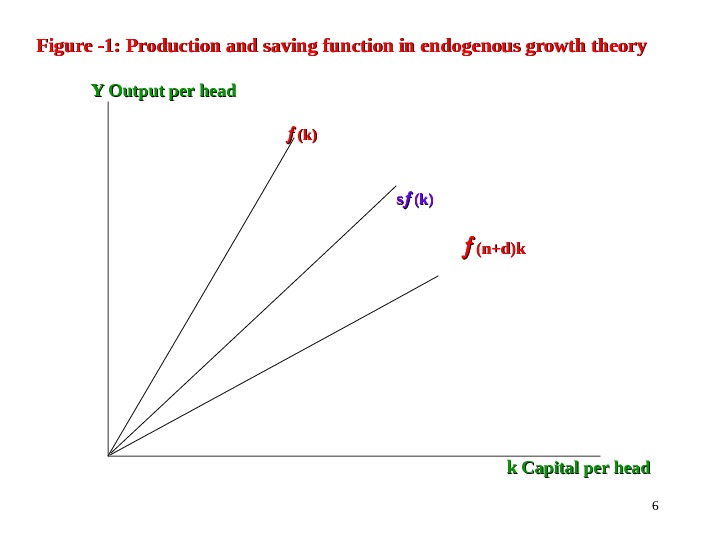
5 Endogenous growth theory (Figure -1) Modifies the shape of the production function It denies law of diminishing marginal return It assumes constant marginal product of capital Saving is everywhere greater than required investment Savings curve no longer flattens out Production and savings curve are straight lines Higher is the savings rate, bigger is the gap between saving and investment and faster is growth (Figure -1)
6 Figure -1: Production and saving function in endogenous growth theory Y Y Output per head (k)(k) ss (k)(k) (n+d)k k k Capital per head
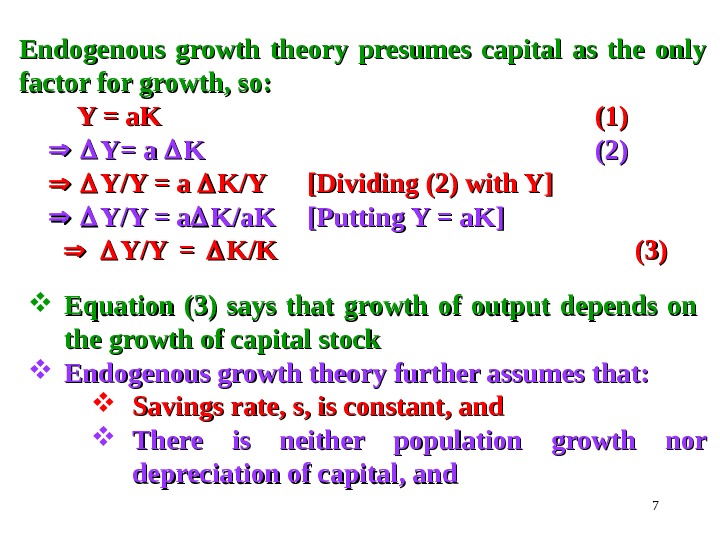
7 Endogenous growth theory presumes capital as the only factor for growth, so: Y = a. K (1)(1) Y= a K K (2)(2) Y/Y = a K/YK/Y [Dividing (2) with Y] Y/Y = a K/a. K [Putting Y = a. K] Y/Y = K/K (3)(3) Equation (3) says that growth of output depends on the growth of capital stock Endogenous growth theory further assumes that: Savings rate, s, is constant, and There is neither population growth nor depreciation of capital, and
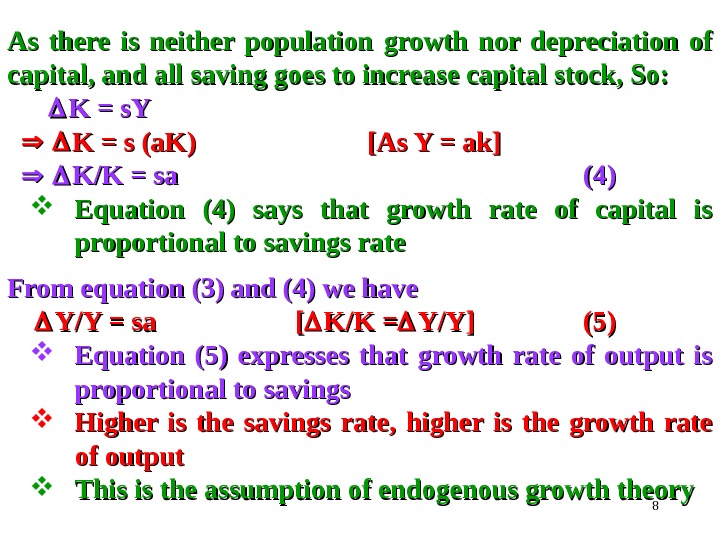
8 As there is neither population growth nor depreciation of capital, and all saving goes to increase capital stock, So: K = s. Y K = s (a. K) [As Y = ak] K/K = sa (4)(4) Equation (4) says that growth rate of capital is proportional to savings rate From equation (3) and (4) we have Y/Y = sa [[ K/K = Y/Y] (5)(5) Equation (5) expresses that growth rate of output is proportional to savings Higher is the savings rate, higher is the growth rate of output This is the assumption of endogenous growth theory
9 Savings and Investment Higher is the savings rate chosen by a society, higher is the steady state capital and income It means, higher is the savings rate, higher is the per capital and per capital income in the steady state. Conclusion: Steady state can be achieved at different living standard. Limitation Higher is k, greater is the investment required to maintain capital-labour ratio Hence, higher is k les is consumption So, too high a savings rate can lead to high income but low consumption
10 Let us assume: Steady-state income equals y* = f (k*) Steady state investment is (n + d) k*, Steady-state consumption is c*, then c* = (k*) – (n + d)k* Conclusion Steady state consumption is maximised, when just enough is invested to cover the increased output Above this level, saving should be cut and more consumed Below this level, consumption should be increased
113. DEEPER ECONOMICS OF ENDOGENOUS GROWTH Difference between neo-classical and endogenous growth theory: Endogenous growth theory abolishes law of diminishing marginal returns It imposes constant returns to scale on capital This violates one of the basic microeconomic principles This implies that: Firms with twice as much capital produces twice as much output This suggests that larger and larger firms grow more and more It means that ultimately a single firm comes to dominate the entire economy
12 Endogenous Growth theory argues Practically, there is no monopoly Individual firm cannot capture all benefits of constant returns to scale at the same time Some of the benefits remain external to firm Some firms use these factors and some firms have other factors of efficiency A firm can not use all factors of productivity at the same time Hence, there is no monopolisation of the economy
13 Further endogenous growth theory separates different capitals: There are not only new machines but new ways of doing things Some firms assume technological advantage because of research Some assume unforeseen (unexpected) opportunity Benefits of new machines can be copied But benefits of new methods and new ideas can not be copied easily Hence monopolisation is hold up
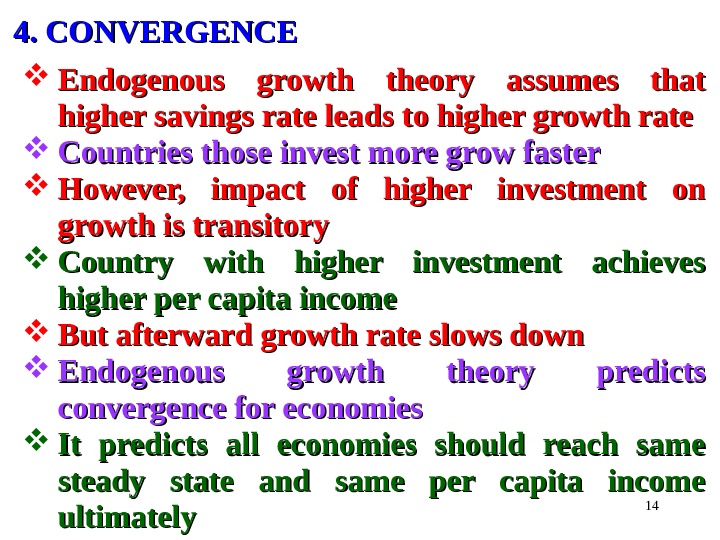
144. CONVERGENCE Endogenous growth theory assumes that higher savings rate leads to higher growth rate Countries those invest more grow faster However, impact of higher investment on growth is transitory Country with higher investment achieves higher per capita income But afterward growth rate slows down Endogenous growth theory predicts convergence for economies It predicts all economies should reach same steady state and same per capita income ultimately
15 For Endogenous growth theory says: Economies converge and converge conditionally Those save and invest more converses fast Those save and invest les converses slowly Hence, international differences in growth rates and per capita income sustain in the time being But growth rate of faster growing countries slows down The growth rate of slowly growing countries goes upup Ultimately all economies should reach same steady state and same per capita income
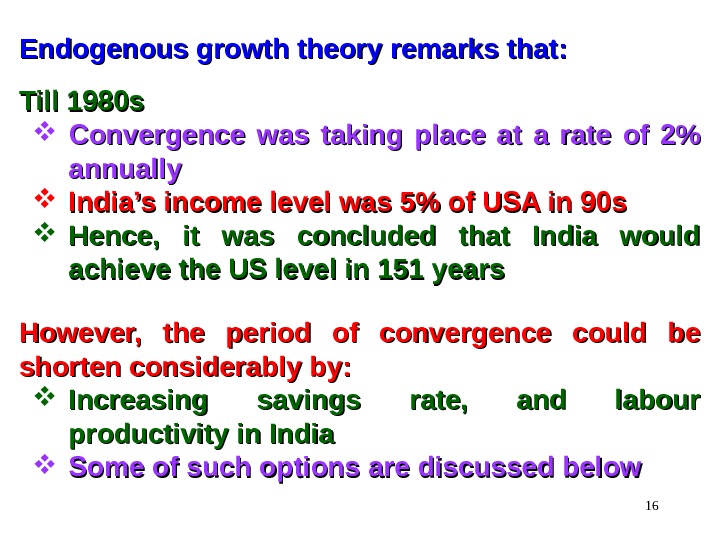
16 Endogenous growth theory remarks that: Till 1980 s Convergence was taking place at a rate of 2% annually India’s income level was 5% of USA in 90 s Hence, it was concluded that India would achieve the US level in 151 years However, the period of convergence could be shorten considerably by: Increasing savings rate, and labour productivity in India Some of such options are discussed below
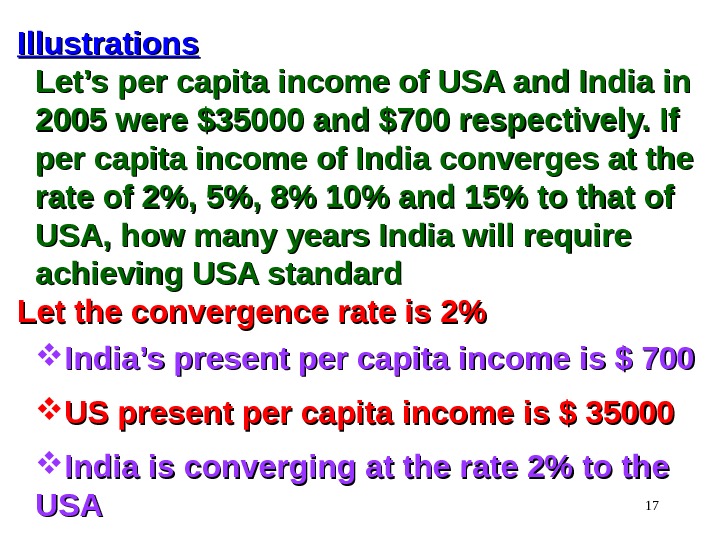
17 Illustrations Let’s per capita income of USA and India in 2005 were $35000 and $700 respectively. If per capita income of India converges at the rate of 2%, 5%, 8% 10% and 15% to that of USA, how many years India will require achieving USA standard Let the convergence rate is 2% India’s present per capita income is $ 700 US present per capita income is $ 35000 India is converging at the rate 2% to the USAUS
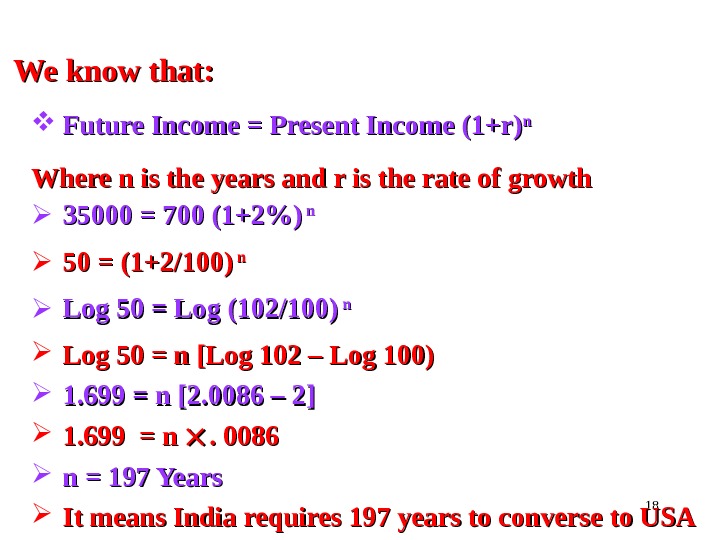
18 We know that: Future Income = Present Income (1+r) nn Where n is the years and r is the rate of growth 35000 = 700 (1+2%) n n 50 = (1+2/100) n n Log 50 = Log (102/100) n n Log 50 = n [Log 102 – Log 100) 1. 699 = n [2. 0086 – 2] 1. 699 = n . 0086 n = 197 Years It means India requires 197 years to converse to US
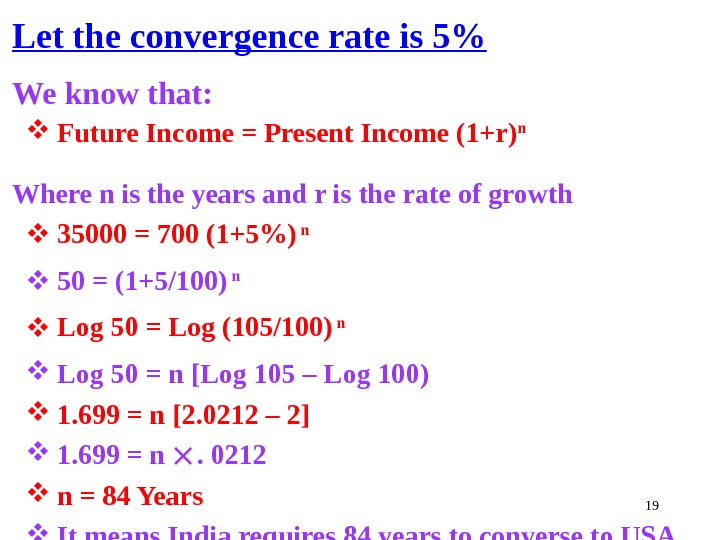
19 Let the convergence rate is 5% We know that: Future Income = Present Income (1+r) n Where n is the years and r is the rate of growth 35000 = 700 (1+5%) n 50 = (1+5/100) n Log 50 = Log (105/100) n Log 50 = n [Log 105 – Log 100) 1. 699 = n [2. 0212 – 2] 1. 699 = n . 0212 n = 84 Years It means India requires 84 years to converse to US
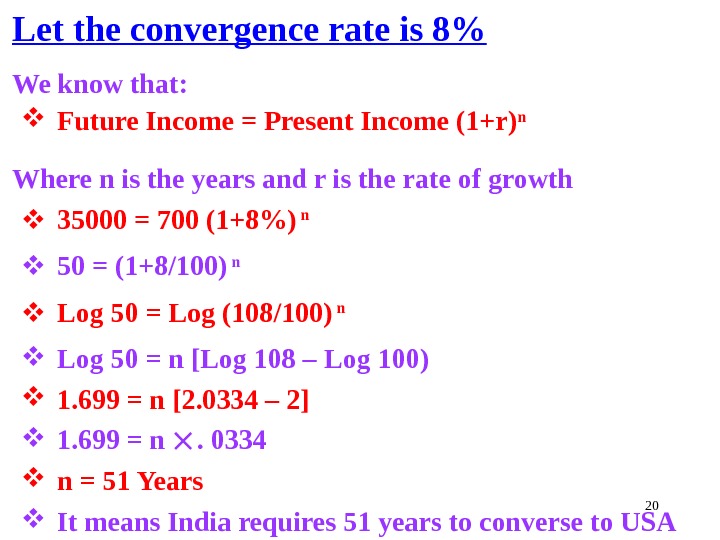
20 Let the convergence rate is 8% We know that: Future Income = Present Income (1+r) n Where n is the years and r is the rate of growth 35000 = 700 (1+8%) n 50 = (1+8/100) n Log 50 = Log (108/100) n Log 50 = n [Log 108 – Log 100) 1. 699 = n [2. 0334 – 2] 1. 699 = n . 0334 n = 51 Years It means India requires 51 years to converse to US
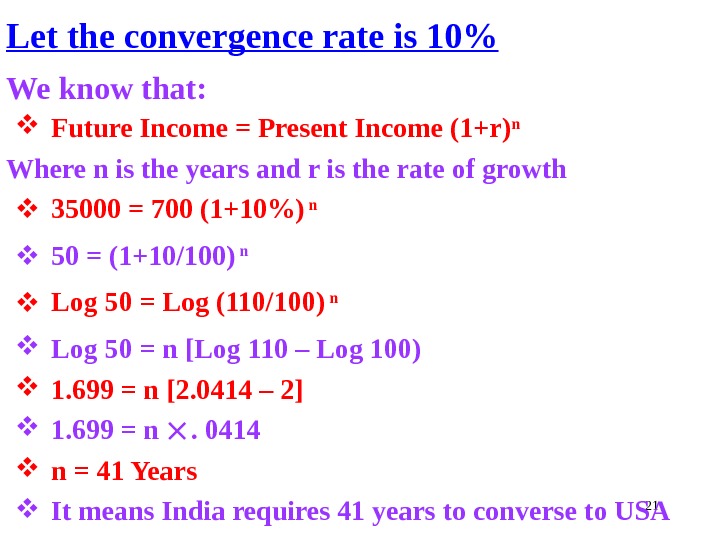
21 Let the convergence rate is 10% We know that: Future Income = Present Income (1+r) n Where n is the years and r is the rate of growth 35000 = 700 (1+10%) n 50 = (1+10/100) n Log 50 = Log (110/100) n Log 50 = n [Log 110 – Log 100) 1. 699 = n [2. 0414 – 2] 1. 699 = n . 0414 n = 41 Years It means India requires 41 years to converse to US
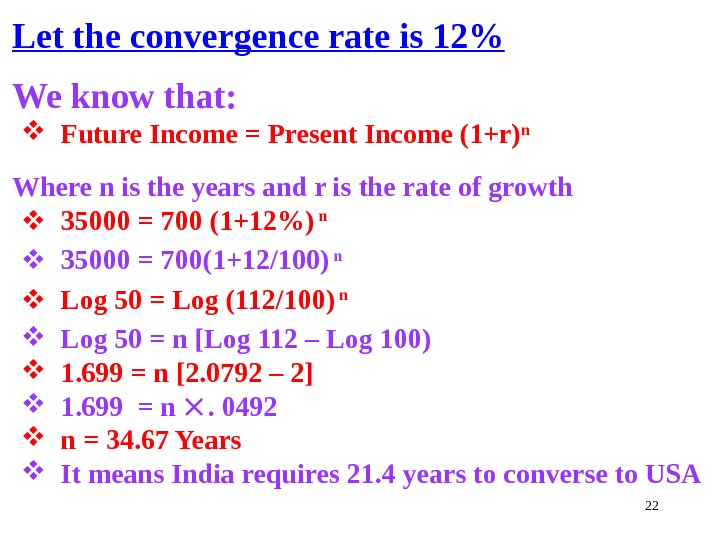
22 Let the convergence rate is 12% We know that: Future Income = Present Income (1+r) n Where n is the years and r is the rate of growth 35000 = 700 (1+12%) n 35000 = 700(1+12/100) n Log 50 = Log (112/100) n Log 50 = n [Log 112 – Log 100) 1. 699 = n [2. 0792 – 2] 1. 699 = n . 0492 n = 34. 67 Years It means India requires 21. 4 years to converse to US
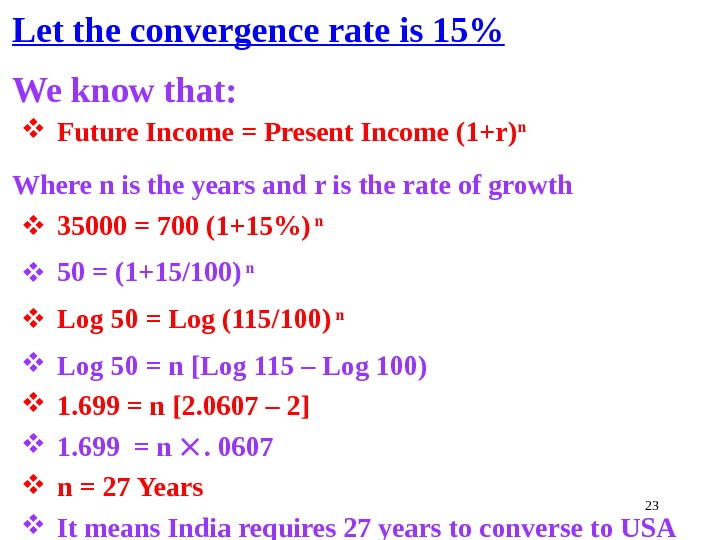
23 Let the convergence rate is 15% We know that: Future Income = Present Income (1+r) n Where n is the years and r is the rate of growth 35000 = 700 (1+15%) n 50 = (1+15/100) n Log 50 = Log (115/100) n Log 50 = n [Log 115 – Log 100) 1. 699 = n [2. 0607 – 2] 1. 699 = n . 0607 n = 27 Years It means India requires 27 years to converse to US
24 Up to 1990 India conversed only at rate of 2% So, she had to wait 151 years to achieve USA standard However, relying on neo-classical force of convergence, India cannot look forward to catch up with USA If, India saves and invests more as Endogenous Growth Theory predicts: It can magically reduce convergence period as above If it can achieve only a growth rate of 8% annually that She is doing now: Convergence time is reduced to 50 years only This is true for all developing countries
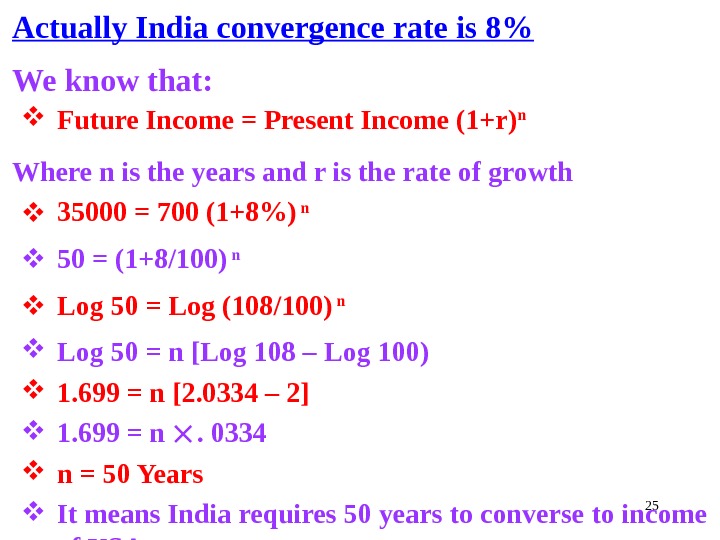
25 Actually India convergence rate is 8% We know that: Future Income = Present Income (1+r) n Where n is the years and r is the rate of growth 35000 = 700 (1+8%) n 50 = (1+8/100) n Log 50 = Log (108/100) n Log 50 = n [Log 108 – Log 100) 1. 699 = n [2. 0334 – 2] 1. 699 = n . 0334 n = 50 Years It means India requires 50 years to converse to income of US
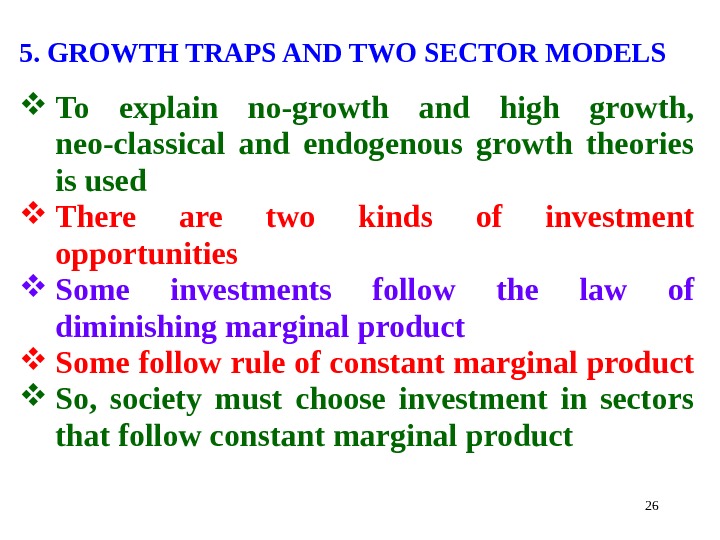
265. GROWTH TRAPS AND TWO SECTOR MODELS To explain no-growth and high growth, neo-classical and endogenous growth theories is used There are two kinds of investment opportunities Some investments follow the law of diminishing marginal product Some follow rule of constant marginal product So, society must choose investment in sectors that follow constant marginal product
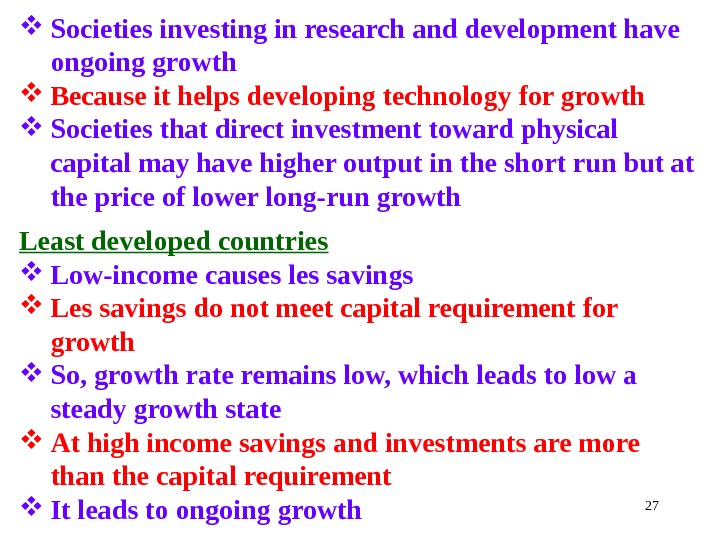
27 Societies investing in research and development have ongoing growth Because it helps developing technology for growth Societies that direct investment toward physical capital may have higher output in the short run but at the price of lower long-run growth Least developed countries Low-income causes les savings Les savings do not meet capital requirement for growth So, growth rate remains low, which leads to low a steady growth state At high income savings and investments are more than the capital requirement It leads to ongoing growth
286. PULATION GROWTH AND ECONOMIC GROWTH Regarding population growth one oldest view is that: Population growth functions against achievement of high incomes Solow’s growth model predicts that High population growth (n) means lower income (and lower steady growth state) Because high population growth means less capital per worker Rich Countries With rising incomes birth rates fall Rich countries are approaching zero population growth
29 Poor Countries Poor countries have high birth resulting high population growth And as incomes rise, death rates fall and population growth rises Poor countries are recognizing need to reduce population growth So, contraceptives are being persuaded and policies instituted Reducing population growth in poor countries is difficult In poor countries large families function as a social security system Children ensures that parents are taken care of in their old age
308. LESSONS FROM THE ASIAN TIGERS Because of high economic growth and quick development Hong Kong, Singapore, South Korea, and Taiwan are called ‘Asian Tigers’ From 1966 to 2000 per capita GDP grew annually in average in (Table-1): Hong Kong 5. 7% Singapore 6. 8% South Korea 6. 8% Taiwan 6. 7% They are seen as model for developing countries
31 They followed some policies, which are worthy of copying: These policies are hard work and sacrifice These countries have: Saved more and invested more Put more people to work Hence, labour force increased from 1966 to 2000 in (Table-1): Hong Kong 38 -49% Singapore 27 -51% South Korea 27 -36% Taiwan 27 -37%
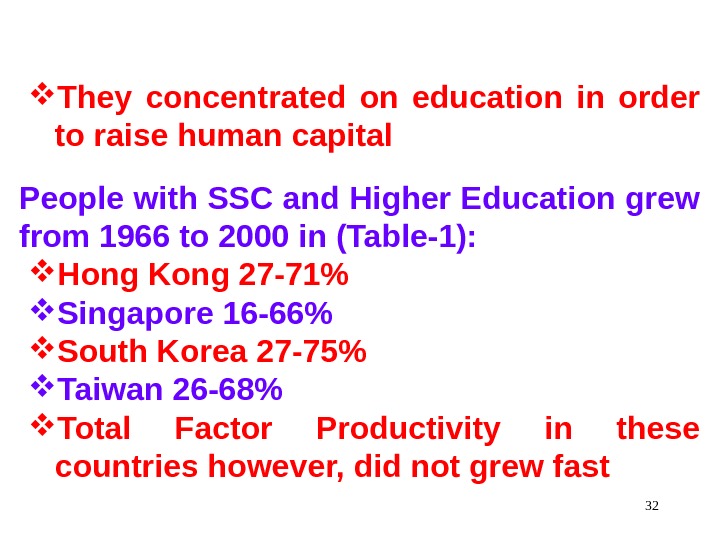
32 They concentrated on education in order to raise human capital People with SSC and Higher Education grew from 1966 to 2000 in (Table-1): Hong Kong 27 -71% Singapore 16 -66% South Korea 27 -75% Taiwan 26 -68% Total Factor Productivity in these countries however, did not grew fast
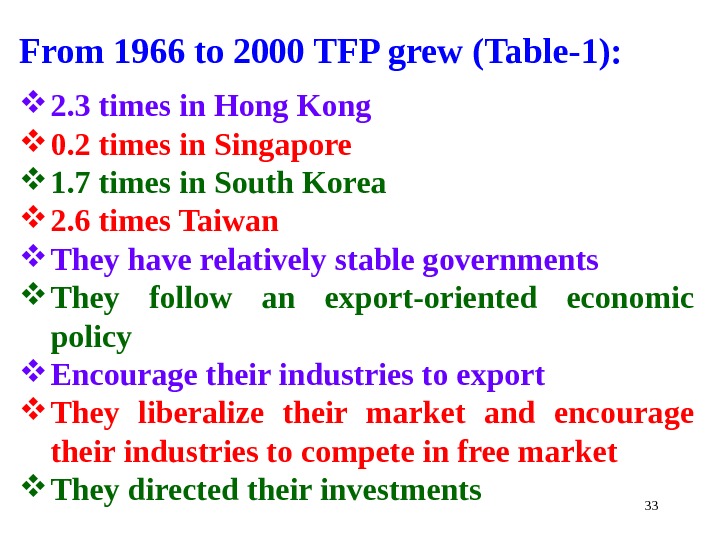
33 From 1966 to 2000 TFP grew (Table-1): 2. 3 times in Hong Kong 0. 2 times in Singapore 1. 7 times in South Korea 2. 6 times Taiwan They have relatively stable governments They follow an export-oriented economic policy Encourage their industries to export They liberalize their market and encourage their industries to compete in free market They directed their investments
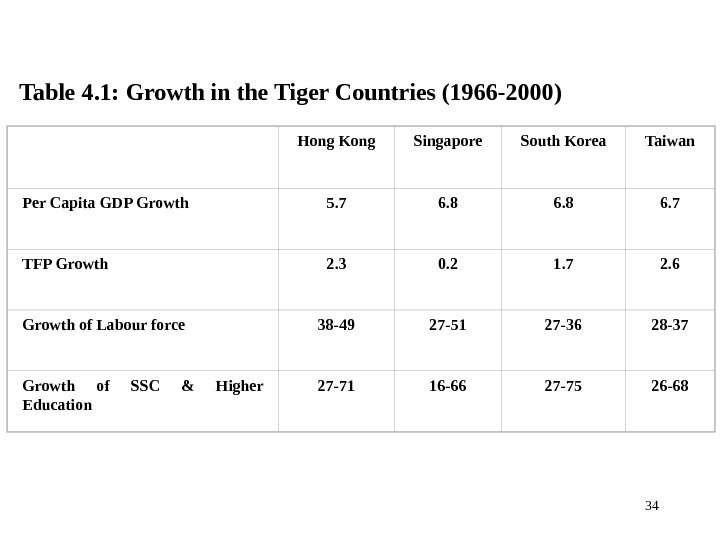
34 Table 4. 1: Growth in the Tiger Countries (1966 -2000) Hong Kong Singapore South Korea Taiwan Per Capita GDP Growth 5. 7 6. 8 6. 7 TFP Growth 2. 3 0. 2 1. 7 2. 6 Growth of Labour force 38 -49 27 -51 27 -36 28 -37 Growth of SSC & Higher Education 27 -71 16 -66 27 -75 26 —
35 They have encouraged foreign investment to bring in new technologies The Tigers Countries have achieved something extraordinary in human history Their high growth rate transformed them from poorest countries to rich countries This is done in the old-fashioned way Through saving, investment, hard work of the labour force and competition
369. THE GROWTH OF POOR COUNTRIES Growth of Bangladesh illustrates a striking problem Till 1990 it had actually no economic growth This is true also for: Burma, Nepal, Ghana, etc Income in these is so low that much of the population lives under subsistence So, savings are very low From 1960 to 1985 investment in Bangladesh was only 4. 6% of GDP In the same time, it was 36. 6% to 24% in Japan and USA respectively
37 What to do Population growth in poor countries was much higher than in Japan & USA- It must be reduced They must invest in human capital They have hostile climates foreign investment – It must be liberalized Enabling economic and legal environment foreign investment must be ascertained Repatriate investments and profits must be guaranteed foreign investments Export must be discouraged
38 Questions Describe the factors on which the growth of the economy depends? Explain indigenous growth theory. Explain the relationship between output and savings according to indigenous growth theory. What is the deeper significance of indigenous growth theory? What is meant by two-sector model of the economy in indigenous growth theory? Discuss the factors those determine the convergence of the economies. Lets per capital annual income of USA is $60000 and of Bangladesh is $700. Let the economy of Bangladesh grows in average at the rate of 6%. How many years will Bangladesh require to the economy standard USA if the economy of USA stagnates? Explain theoretical lesson from the ‘Asian Tiger Countries’. Explain the impact of rate of population growth on economic growth of a developing economy.
39 End of the Chapter Thank You Very Much For Patient Listening