
1 Book 2 – Oil – March 2009


- Размер: 1.8 Mегабайта
- Количество слайдов: 14
Описание презентации 1 Book 2 – Oil – March 2009 по слайдам
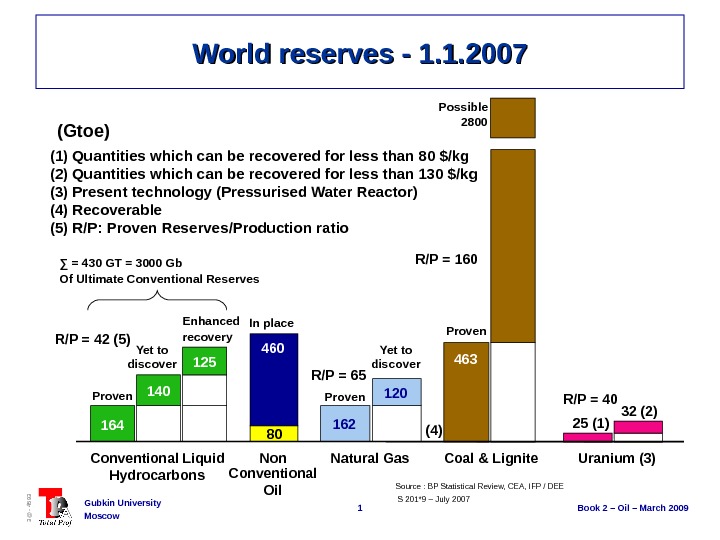
1 Book 2 – Oil – March 2009 Gubkin University Moscow 3@ — 4593 R/P = 42 (5) R/P = 65 R/P = 160 R/P = 40 World reserves — 1. 1. 2007 Source : BP Statistical Review, CEA, IFP / DEE(Gtoe) (1) Quantities which can be recovered for less than 80 $/kg (2) Quantities which can be recovered for less than 130 $/kg (3) Present technology (Pressurised Water Reactor) (4) Recoverable (5) R/P: Proven Reserves/Production ratio S 201*9 – July 2007 Non Conventional Oil. Proven 164 Proven Yet to discover Enhanced recovery 125 Proven 162 120 In place Possible 2800 460 80 463 Conventional Liquid Hydrocarbons Natural Gas Coal & Lignite Uranium (3)(4)140 25 (1) 32 (2)Yet to discover∑ = 430 GT = 3000 Gb Of Ultimate Conventional Reserves
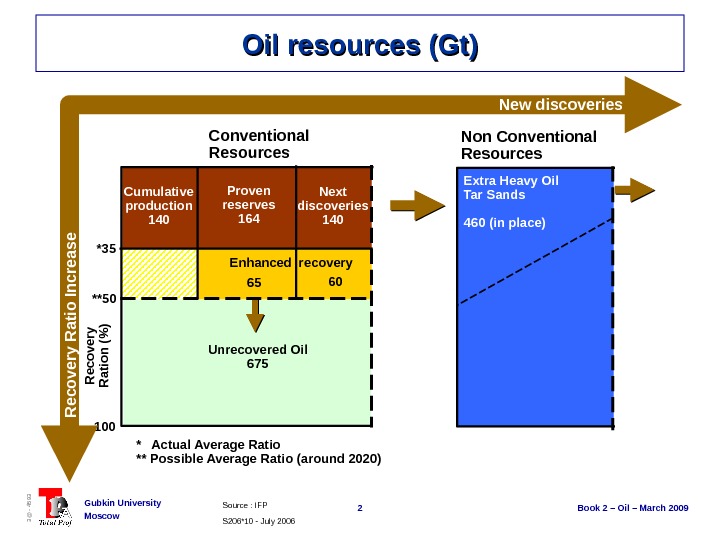
2 Book 2 – Oil – March 2009 Gubkin University Moscow 3@ — 4593 *35 **50 100 Conventional Resources Non Conventional Resources Cumulative production 140 Unrecovered Oil 675 Extra Heavy Oil Tar Sands 460 (in place) New discoveries R ecovery R atio Increase Recovery Ration (% ) * Actual Average Ratio ** Possible Average Ratio (around 2020) Proven reserves 164 Next discoveries 140 S 206*10 — July 2006 Source : IFP Oil resources (Gt) Enhanced recovery
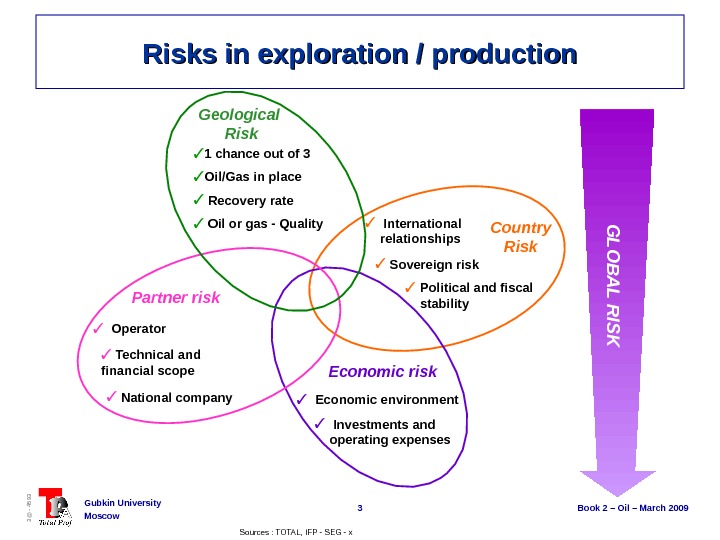
3 Book 2 – Oil – March 2009 Gubkin University Moscow 3@ — 4593 Risks in exploration / production International relationships Country Risk Sovereign risk Political and fiscal stability Economic risk Economic environment Investments and operating expenses. Partner risk Operator National company Technical and financial scope G L O B A L R IS K Geological Risk 1 chance out of 3 Oil/Gas in place Recovery rate Oil or gas — Quality Sources : TOTAL, IFP — SEG — x
4 Book 2 – Oil – March 2009 Gubkin University Moscow 3@ — 4593 History of important discoveries in the world Sources : TOTAL, IFP — SEG — x. Size Mboe A few figures illustrating Peak Oil and Peak Gas Number of Discoveries 1960 s 1970 s 1980 s 1990 s 50 — 100 235 261 300 314 100 — 200 105 162 113 90 200 — 500 179 208 170 154 500 — 1000 90 95 66 52 +
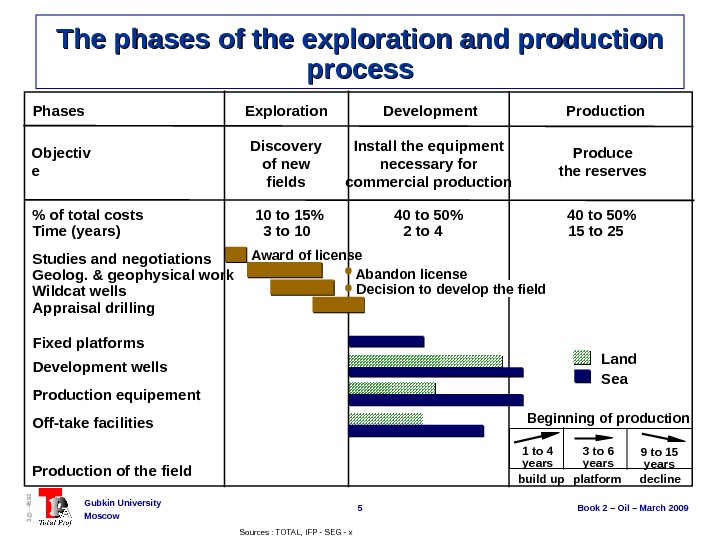
5 Book 2 – Oil – March 2009 Gubkin University Moscow 3@ — 4593 Decision to develop the field. Award of license Abandon license Beginning of production 1 to 4 years 3 to 6 years 9 to 15 years build up platform decline. Land Sea% of total costs Time (years) Studies and negotiations Geolog. & geophysical work Wildcat wells Appraisal drilling Fixed platforms Development wells Production equipement Off-take facilities Production of the field 10 to 15% 3 to 10 40 to 50% 2 to 4 40 to 50% 15 to 25 Discovery of new fields Install the equipment necessary for commercial production Produce the reserves. Objectiv e Phases Exploration Development Production. The phases of the exploration and production process Sources : TOTAL, IFP — SEG — x
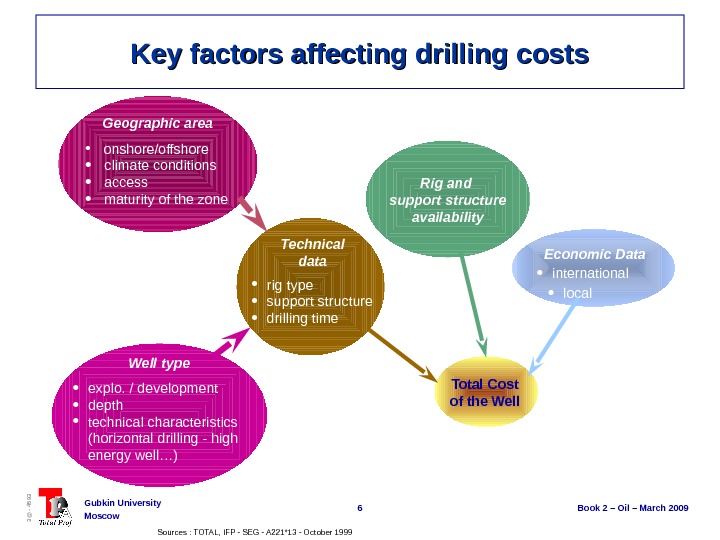
6 Book 2 – Oil – March 2009 Gubkin University Moscow 3@ — 4593 Key factors affecting drilling costs onshore/offshore climate conditions access maturity of the zone. Geographic area explo. / development depth technical characteristics (horizontal drilling — high energy well…) Well type rig type support structure drilling time Technical data Rig and support structure availability Economic Data international local Total Cost of the Well Sources : TOTAL, IFP — SEG — A 221*13 — October
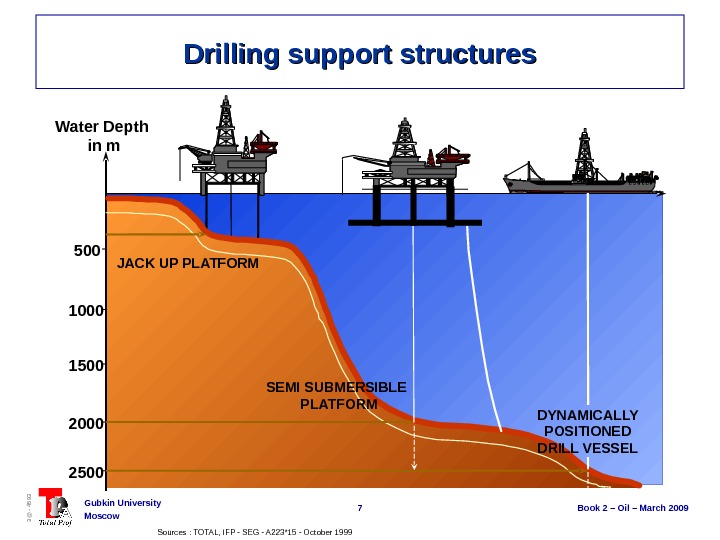
7 Book 2 – Oil – March 2009 Gubkin University Moscow 3@ — 4593 Drilling support structures 500 1000 1500 Water Depth in m 2000 2500 JACK UP PLATFORM SEMI SUBMERSIBLE PLATFORM DYNAMICALLY POSITIONED DRILL VESSEL Sources : TOTAL, IFP — SEG — A 223*15 — October
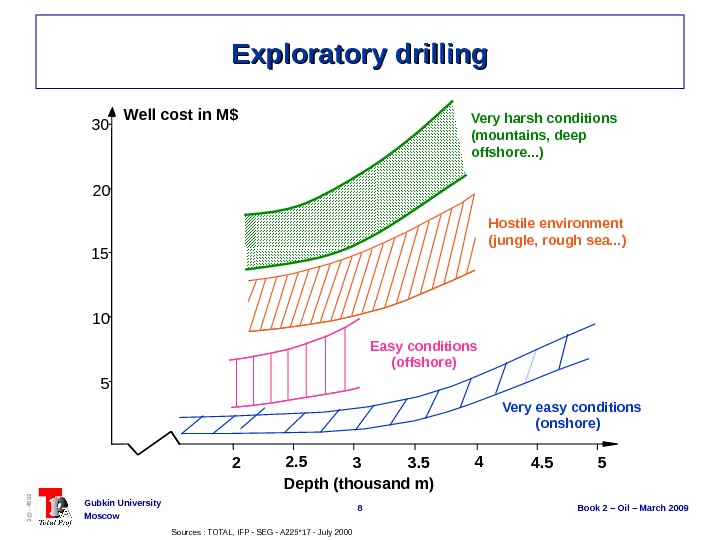
8 Book 2 – Oil – March 2009 Gubkin University Moscow 3@ — 4593 Exploratory drilling Well cost in M$ 2 2. 5 3 3. 5 4 4. 5 5 Depth (thousand m) Very easy conditions (onshore) Easy conditions (offshore) Hostile environment (jungle, rough sea. . . )20 15 10 530 Very harsh conditions (mountains, deep offshore. . . ) Sources : TOTAL, IFP — SEG — A 225*17 — July
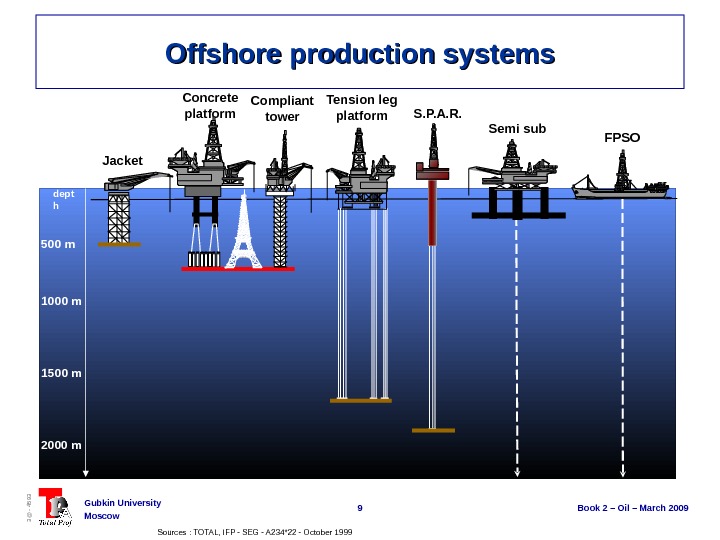
9 Book 2 – Oil – March 2009 Gubkin University Moscow 3@ — 4593 Offshore production systems Semi sub FPSO Jacket Concrete platform Compliant tower Tension leg platform S. P. A. R. 500 m 1000 m 1500 m 2000 m Wat er dept h Sources : TOTAL, IFP — SEG — A 234*22 — October
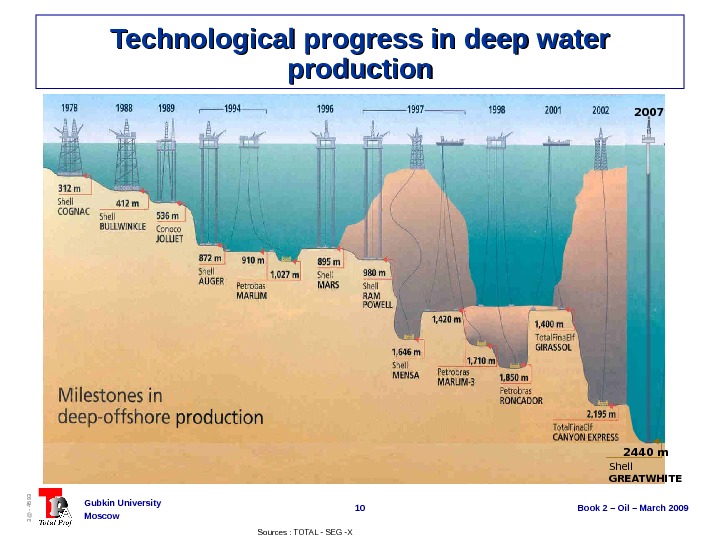
10 Book 2 – Oil – March 2009 Gubkin University Moscow 3@ — 4593 Technological progress in deep water production 2007 2440 m Shell GREATWHITE Sources : TOTAL — SEG -X
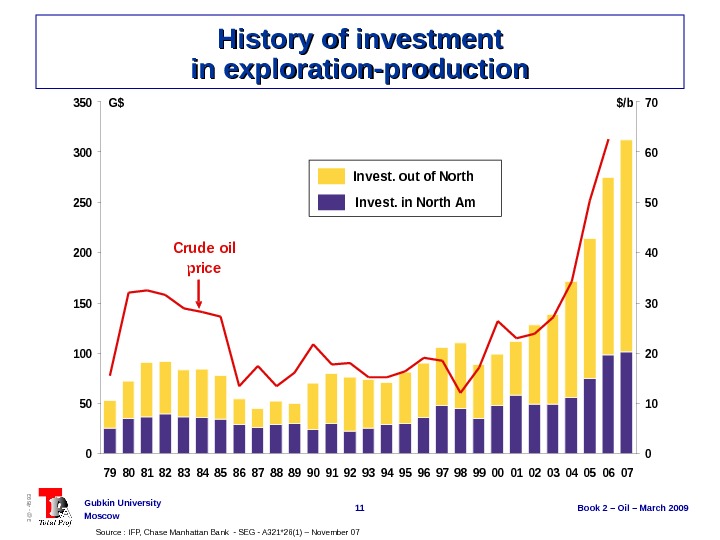
11 Book 2 – Oil – March 2009 Gubkin University Moscow 3@ — 4593 History of investment in exploration-production Source : IFP, Chase Manhattan Bank — SEG — A 321*26(1) – November 07 0 50 100 150 200 250 300 350 7980818283848586878889909192939495969798990001020304050607 0 10 20 30 40 50 60 70 Invest. out of North Invest. in North Am G$$/b Crude oil price
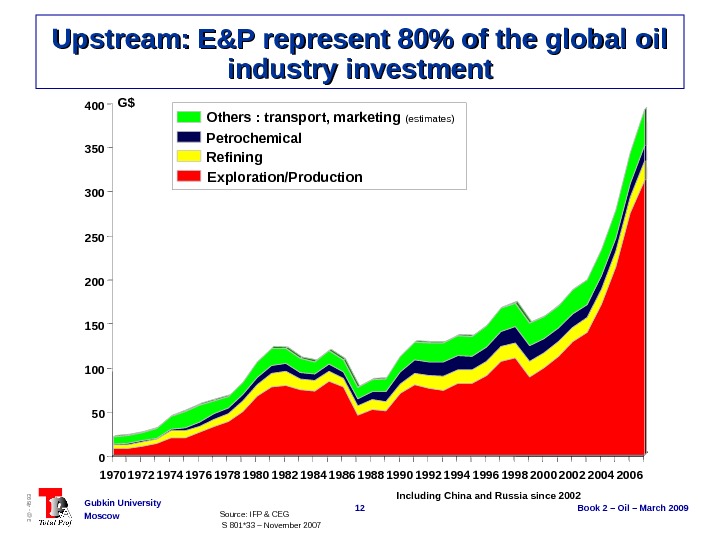
12 Book 2 – Oil – March 2009 Gubkin University Moscow 3@ — 4593 Upstream: E&P represent 80% of the global oil industry investment Source: IFP & CEG S 801*33 – November 2007 Including China and Russia since 2002 Others : transport, marketing (estimates) Petrochemical Refining Exploration/Production. G$
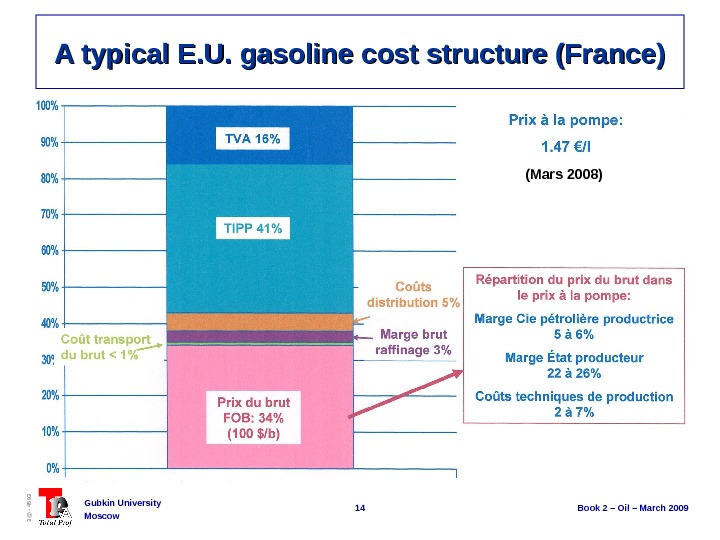
13 Book 2 – Oil – March 2009 Gubkin University Moscow 3@ — 4593 The key paradoxes of the oil industry At 100 $/b crude oil, the upstream worlwide average technical costs represent 15% (10% for the producing companies and around 75% for the producing countries « government take » ). At the 100 $/b this « crude oil cost » represent an average 30% of the pumps prices in the E. U. (10% downstream costs for refining and distribution and around 60% for the consumming countries « government take » ).
14 Book 2 – Oil – March 2009 Gubkin University Moscow 3@ — 4593 A typical E. U. gasoline cost structure (France) (Mars 2008)