
1 — 11 Unit# 5 Process Analysis


- Размер: 803 Кб
- Количество слайдов: 29
Описание презентации 1 — 11 Unit# 5 Process Analysis по слайдам
1 — 11 Unit# 5 Process Analysis
1 — 22 • Process Analysis • Process Flowcharting • Types of Processes • Process Performance Metrics. OBJECTIVES
1 — 33 Process Analysis Terms • Process : Is any part of an organization that takes inputs and transforms them into outputs • Cycle Time : Is the average successive time between completions of successive units • Utilization : Is the ratio of the time that a resource is actually activated relative to the time that it is available for use
1 — 44 Process Flowcharting Defined • Process flowcharting is the use of a diagram to present the major elements of a process • The basic elements can include tasks or operations, flows of materials or customers, decision points, and storage areas or queues • It is an ideal methodology by which to begin analyzing a process
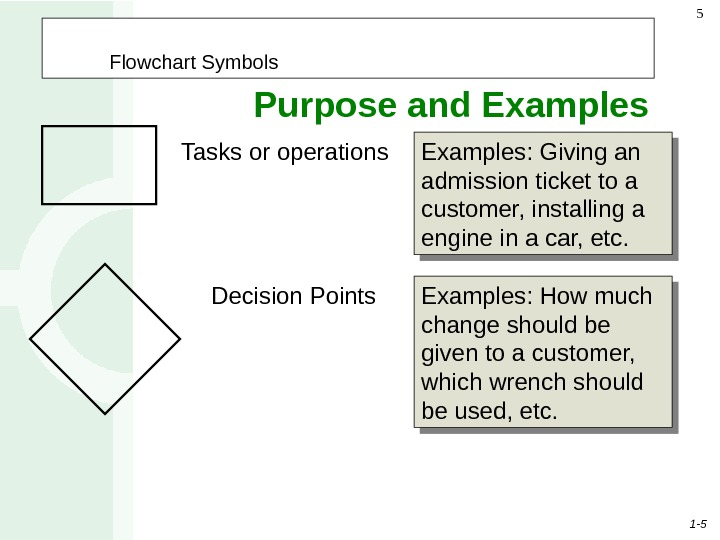
1 — 55 Tasks or operations Examples: Giving an admission ticket to a customer, installing a engine in a car, etc. Decision Points Examples: How much change should be given to a customer, which wrench should be used, etc. Purpose and Examples Flowchart Symbols
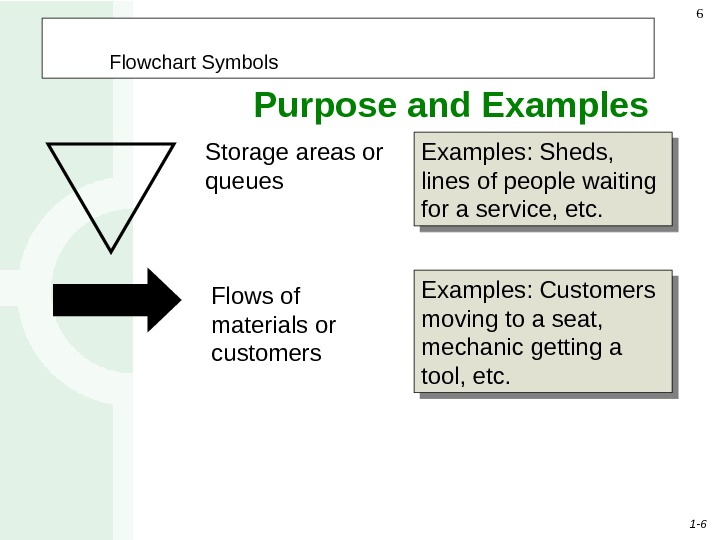
1 — 66 Examples: Sheds, lines of people waiting for a service, etc. Examples: Customers moving to a seat, mechanic getting a tool, etc. Storage areas or queues Flows of materials or customers Purpose and Examples Flowchart Symbols
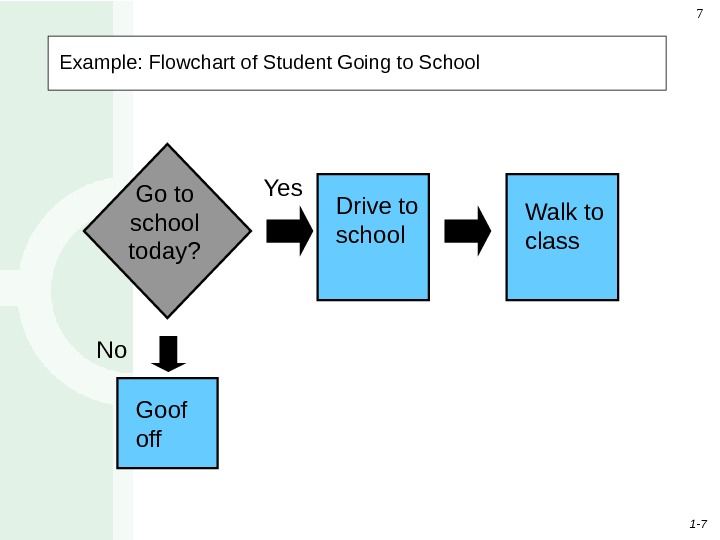
1 — 77 Example: Flowchart of Student Going to School Yes No Goof off. Go to school today? Walk to class. Drive to school
1 — 88 Types of Processes Single-stage Process Stage 1 Stage 2 Stage 3 Multi-stage Process
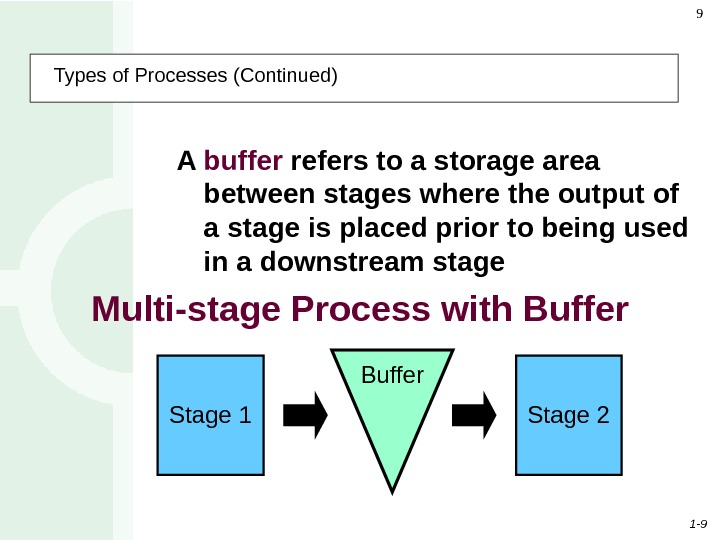
1 — 99 Types of Processes (Continued) Stage 1 Stage 2 Buffer. Multi-stage Process with Buffer A buffer refers to a storage area between stages where the output of a stage is placed prior to being used in a downstream stage
1 — 10 10 Other Process Terminology • Blocking – Occurs when the activities in a stage must stop because there is no place to deposit the item just completed – If there is no room for an employee to place a unit of work down, the employee will hold on to it not able to continue working on the next unit • Starving – Occurs when the activities in a stage must stop because there is no work – If an employee is waiting at a work station and no work is coming to the employee to process, the employee will remain idle until the next unit of work comes
1 — 11 11 Other Process Terminology (Continued) • Bottleneck – Occurs when the limited capacity of a process causes work to pile up or become unevenly distributed in the flow of a process – If an employee works too slow in a multi-stage process, work will begin to pile up in front of that employee. In this is case the employee represents the limited capacity causing the bottleneck. • Pacing – Refers to the fixed timing of the movement of items through the process
1 — 12 12 Other Types of Processes • Make-to-order – Only activated in response to an actual order – Both work-in-process and finished goods inventory kept to a minimum • Make-to-stock – Process activated to meet expected or forecast demand – Customer orders are served from target stocking level
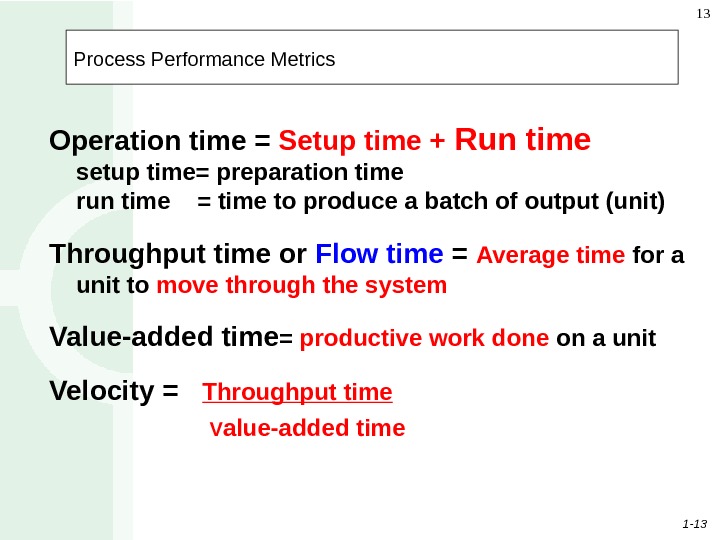
1 — 13 13 Process Performance Metrics Operation time = Setup time + Run time setup time= preparation time run time = time to produce a batch of output (unit) Throughput time or Flow time = Average time for a unit to move through the system Value-added time = productive work done on a unit Velocity = Throughput time V alue-added time
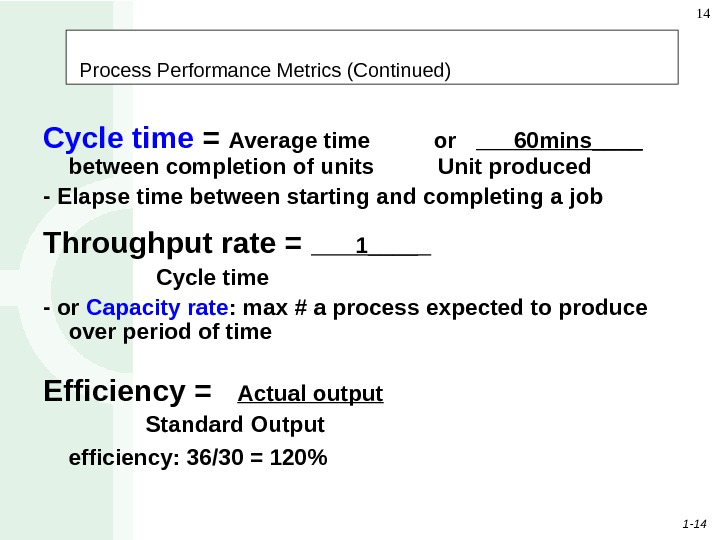
1 — 14 14 Process Performance Metrics (Continued) Cycle time = Average time or 60 mins____ between completion of units Unit produced — Elapse time between starting and completing a job Throughput rate = 1____ Cycle time — or Capacity rate : max # a process expected to produce over period of time Efficiency = Actual output Standard Output efficiency: 36/30 = 120%
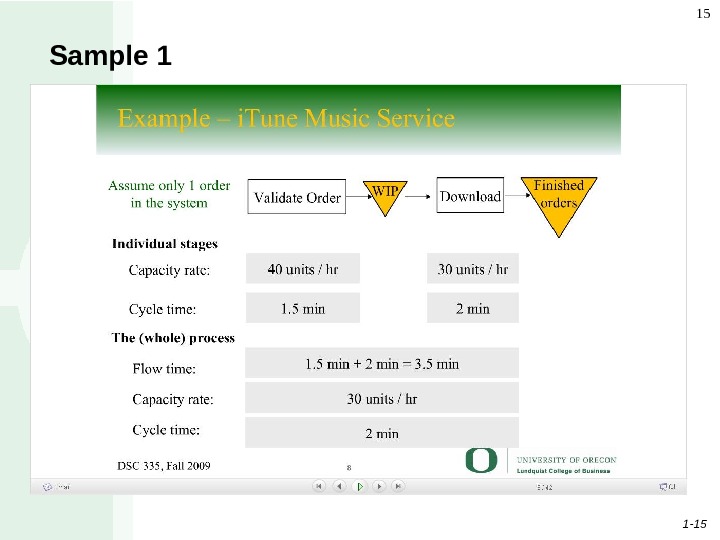
1 — 15 15 Sample
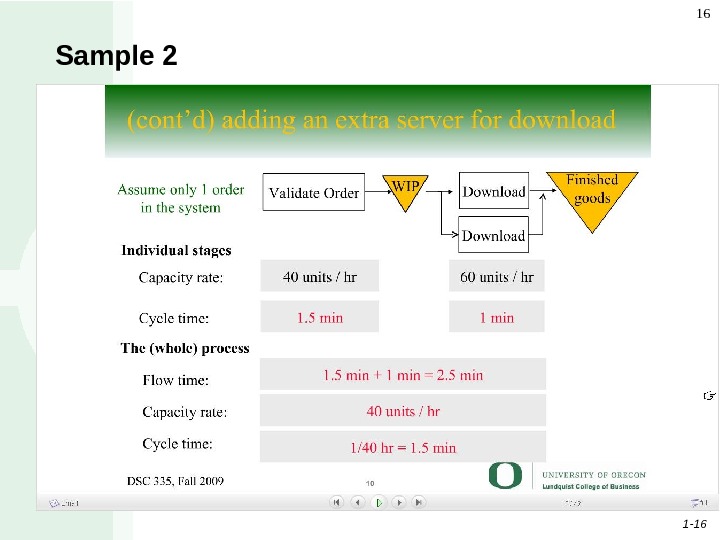
1 — 16 16 Sample
1 — 17 17 Process Performance Metrics (Continued) Productivity = Output Input Utilization = Time Activated Time Available
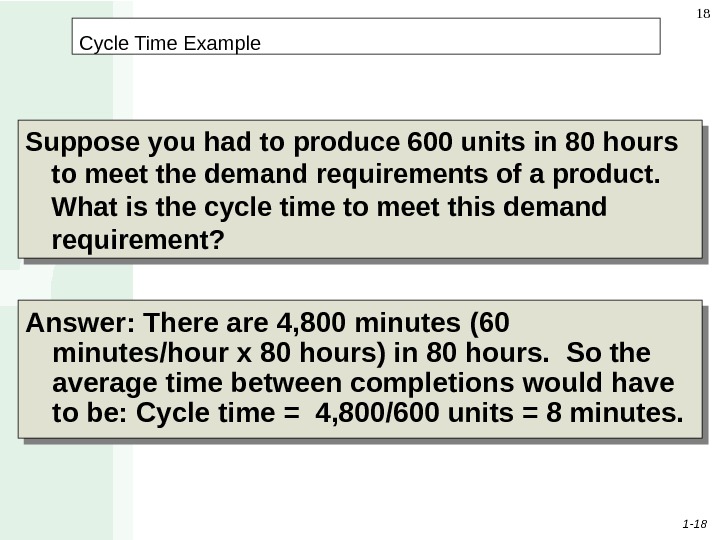
1 — 18 18 Cycle Time Example Suppose you had to produce 600 units in 80 hours to meet the demand requirements of a product. What is the cycle time to meet this demand requirement? Answer: There are 4, 800 minutes (60 minutes/hour x 80 hours) in 80 hours. So the average time between completions would have to be: Cycle time = 4, 800/600 units = 8 minutes.
1 — 19 19 Process Throughput Time Reduction • Perform activities in parallel • Change the sequence of activities • Reduce interruptions
1 — 20 20 Flowchart Exercise • Using flowchart, expand the place item into a plastic bags to highlight set of tasks that includes checking if all items are in bags , than stop packing or else place items into plastic bags. It also includes checking if the bag is full than place the next item into a new bag.
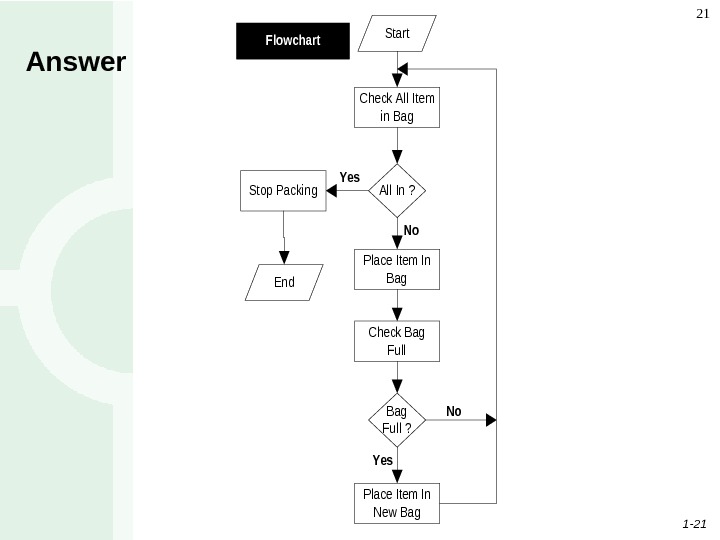
1 — 21 21 Answer. Start Check All Item in Bag Stop Packing. All In ? Place Item In Bag Check Bag Full ? Place Item In New Bag Yes No No End Flowchart
1 — 22 22 Question Bowl Which of the following are possible examples of “cycle times”? a. Time for each television to come off an assembly line. b. Time it takes for a stock purchase c. Time it takes for an instructor to grade an exam d. Time it takes to build an automobile e. All of the above Answer: e. All of the above
1 — 23 23 Question Bowl Which of the following are used as symbols in a Process Flowchart? a. Decision points b. Blocking c. Starving d. Bottleneck e. All of the above Answer: a. Decision points (A diamond shaped symbol. )
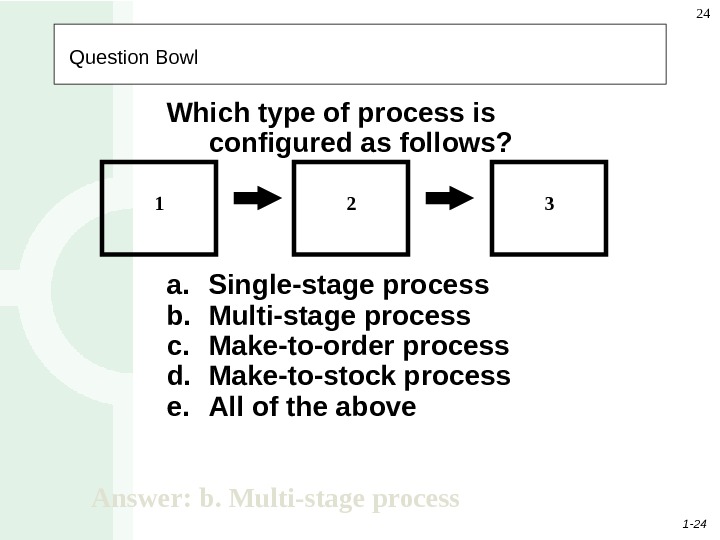
1 — 24 24 Question Bowl Which type of process is configured as follows? a. Single-stage process b. Multi-stage process c. Make-to-order process d. Make-to-stock process e. All of the above Answer: b. Multi-stage process
1 — 25 25 Question Bowl When an assembly line employee is waiting for a unit of work to come down the line so they can stop being idle and get back to work, it is an example of which of the following process terms? a. Buffering b. Blocking c. Starving d. Bottleneck e. All of the above Answer: c. Starving
1 — 26 26 Question Bowl When a company waits until they have an order for their product in hand before beginning any production for that order, we can characterize their operation as which of the following processes? a. Single-stage process b. Multi-stage process c. Make-to-order process d. Make-to-stock process e. All of the above Answer: c. Make-to-order process
1 — 27 27 Question Bowl If the Run Time for a batch of parts is 45 minutes on a machine, and the Setup Time is 65 minutes, which of the following is the Operation Time? a. 75 minutes b. 110 minutes c. Only 45 minutes d. 65/45 minutes or 1. 44 hours e. Can not be computed on the data above Answer: b. 110 minutes ( Operation Time is the sum of Run Time and Setup Time, or 65 + 45 = 110 minutes)
1 — 28 28 Question Bowl If the standard expected phone calls for a telephone marketers is 24 per hour, and one telephone marketer did 27 per hour, which of the following can be used to describe their Efficiency? a. 88. 8% b. 100% c. 112. 5% d. Well over 150% e. Can not computed on the information given. Answer: c. 112. 5% (Ratio of actual performance/expected performance, or (27/24) x 100 = 110 minutes)
1 — 29 29 End of Unit#